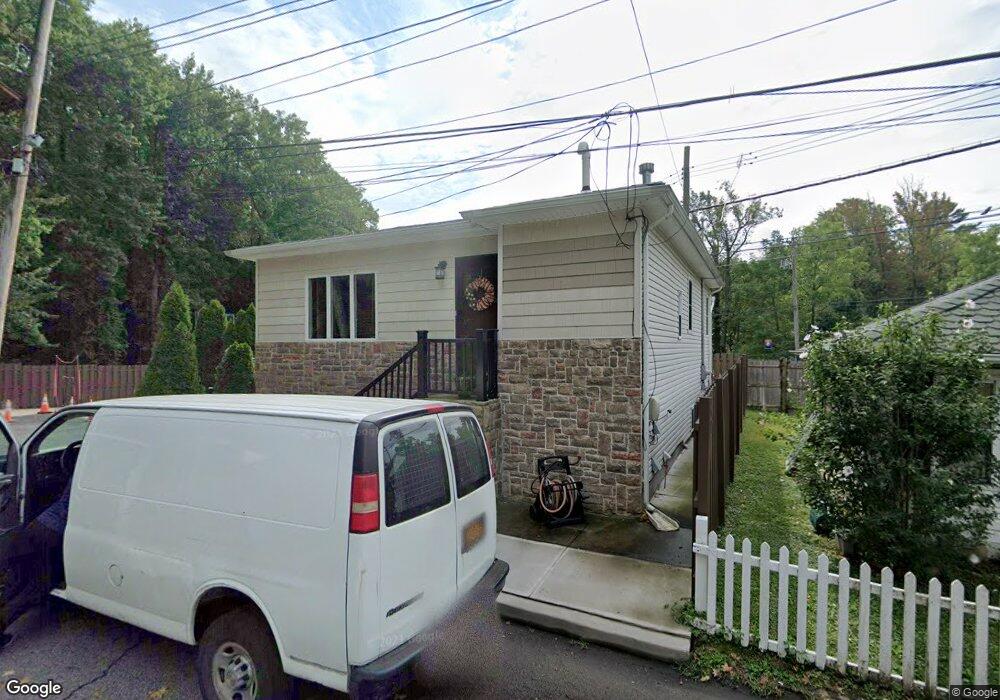
19 Dole St Unit 19-21 Staten Island, NY 10312
Annadale NeighborhoodEstimated Value: $693,000 - $940,000
2
Beds
1
Bath
604
Sq Ft
$1,308/Sq Ft
Est. Value
About This Home
This home is located at 19 Dole St Unit 19-21, Staten Island, NY 10312 and is currently estimated at $790,144, approximately $1,308 per square foot. 19 Dole St Unit 19-21 is a home located in Richmond County with nearby schools including P.S. 5 - Huguenot, I.S. 007 Elias Bernstein, and Tottenville High School.
Ownership History
Date
Name
Owned For
Owner Type
Purchase Details
Closed on
Oct 4, 2011
Sold by
Iron Art Management Corp
Bought by
Tucker Raymond
Current Estimated Value
Home Financials for this Owner
Home Financials are based on the most recent Mortgage that was taken out on this home.
Original Mortgage
$371,806
Outstanding Balance
$257,226
Interest Rate
4.4%
Mortgage Type
FHA
Estimated Equity
$532,918
Purchase Details
Closed on
Nov 24, 2008
Sold by
Morequity Inc
Bought by
Iron Art Management Corp
Purchase Details
Closed on
Jan 9, 2008
Sold by
Madsen Thorbjorn and New York City Transit Adjudica
Bought by
Morequity Inc
Purchase Details
Closed on
Mar 24, 1995
Sold by
Bottega Grace and Falco Richard
Bought by
Madsen Thorbjorn
Home Financials for this Owner
Home Financials are based on the most recent Mortgage that was taken out on this home.
Original Mortgage
$25,000
Interest Rate
7%
Create a Home Valuation Report for This Property
The Home Valuation Report is an in-depth analysis detailing your home's value as well as a comparison with similar homes in the area
Home Values in the Area
Average Home Value in this Area
Purchase History
| Date | Buyer | Sale Price | Title Company |
|---|---|---|---|
| Tucker Raymond | $387,500 | None Available | |
| Iron Art Management Corp | $220,000 | Fidelity Natl Title Ins Co | |
| Morequity Inc | $155,230 | None Available | |
| Madsen Thorbjorn | $42,500 | Commonwealth Land Title Ins |
Source: Public Records
Mortgage History
| Date | Status | Borrower | Loan Amount |
|---|---|---|---|
| Open | Tucker Raymond | $371,806 | |
| Previous Owner | Madsen Thorbjorn | $25,000 |
Source: Public Records
Tax History Compared to Growth
Tax History
| Year | Tax Paid | Tax Assessment Tax Assessment Total Assessment is a certain percentage of the fair market value that is determined by local assessors to be the total taxable value of land and additions on the property. | Land | Improvement |
|---|---|---|---|---|
| 2025 | $5,008 | $48,960 | $9,134 | $39,826 |
| 2024 | $5,008 | $40,020 | $10,542 | $29,478 |
| 2023 | $4,977 | $24,505 | $9,440 | $15,065 |
| 2022 | $4,879 | $38,520 | $16,920 | $21,600 |
| 2021 | $4,913 | $40,620 | $16,920 | $23,700 |
| 2020 | $4,662 | $36,540 | $16,920 | $19,620 |
| 2019 | $4,347 | $31,740 | $16,920 | $14,820 |
| 2018 | $4,163 | $20,421 | $12,253 | $8,168 |
| 2017 | $4,152 | $20,368 | $10,676 | $9,692 |
| 2016 | $3,889 | $19,455 | $8,667 | $10,788 |
| 2015 | $3,323 | $18,354 | $8,457 | $9,897 |
| 2014 | $3,323 | $17,316 | $8,789 | $8,527 |
Source: Public Records
Map
Nearby Homes
- 59 Newton St
- 344 Poillon Ave
- 350 Poillon Ave
- 389 Philip Ave
- 393 Philip Ave
- 383 Philip Ave
- 311 Bertram Ave
- 314 Bertram Ave
- 21 Allen Place
- 84 Discala Ln
- 304 Bertram Ave
- 262 Noel St
- 5 Nicolosi Dr
- 115 Jansen St
- 16 Nicolosi Loop
- 52 Nicolosi Loop
- 161 Boardwalk Ave
- 381 Arbutus Ave
- 47 Ravenna St
- 207 Eylandt St