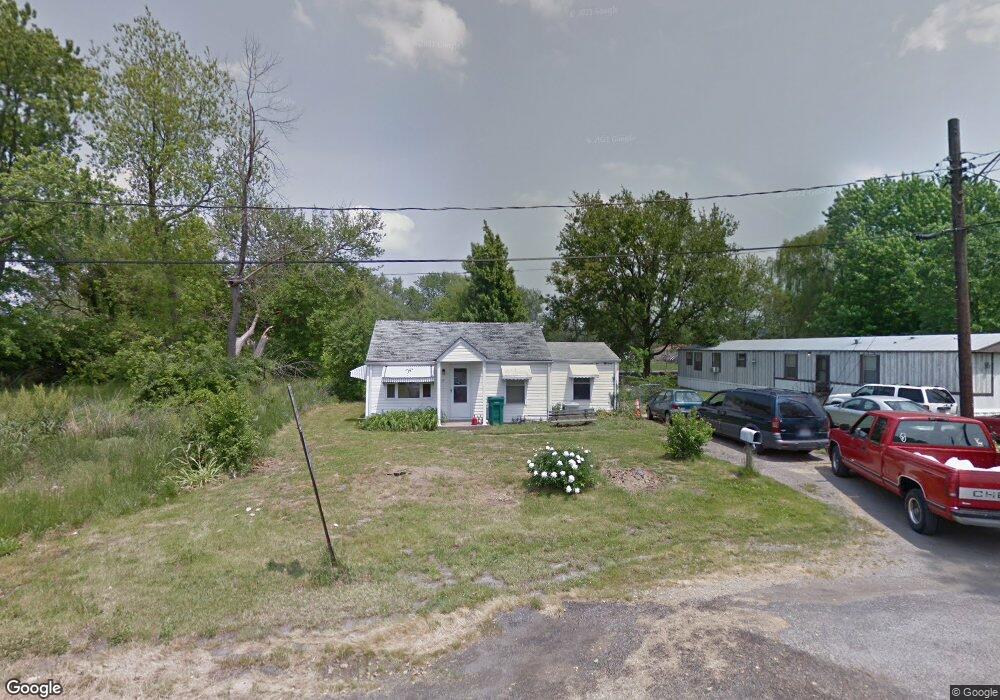
19 Dolly St East Saint Louis, IL 62207
Estimated Value: $28,000 - $53,000
--
Bed
--
Bath
656
Sq Ft
$62/Sq Ft
Est. Value
About This Home
This home is located at 19 Dolly St, East Saint Louis, IL 62207 and is currently estimated at $40,838, approximately $62 per square foot. 19 Dolly St is a home located in St. Clair County.
Ownership History
Date
Name
Owned For
Owner Type
Purchase Details
Closed on
Aug 18, 2025
Sold by
St Clair County Clerk
Bought by
St Clair County
Current Estimated Value
Purchase Details
Closed on
May 31, 2017
Sold by
Hughes Nick
Bought by
Garrett Randy
Purchase Details
Closed on
Aug 5, 2005
Sold by
Hughes Nick
Bought by
Hughes Nick
Home Financials for this Owner
Home Financials are based on the most recent Mortgage that was taken out on this home.
Original Mortgage
$40,000
Interest Rate
5.66%
Mortgage Type
New Conventional
Purchase Details
Closed on
May 28, 2004
Sold by
Hughes Helen M and Hughes Nick B
Bought by
Hughes Helen M and Hughes Nick R
Create a Home Valuation Report for This Property
The Home Valuation Report is an in-depth analysis detailing your home's value as well as a comparison with similar homes in the area
Home Values in the Area
Average Home Value in this Area
Purchase History
| Date | Buyer | Sale Price | Title Company |
|---|---|---|---|
| St Clair County | -- | None Available | |
| Garrett Randy | $3,500 | None Available | |
| Hughes Nick | -- | Agape Title Insurance Co Inc | |
| Hughes Helen M | -- | -- |
Source: Public Records
Mortgage History
| Date | Status | Borrower | Loan Amount |
|---|---|---|---|
| Previous Owner | Hughes Nick | $40,000 |
Source: Public Records
Tax History Compared to Growth
Tax History
| Year | Tax Paid | Tax Assessment Tax Assessment Total Assessment is a certain percentage of the fair market value that is determined by local assessors to be the total taxable value of land and additions on the property. | Land | Improvement |
|---|---|---|---|---|
| 2024 | $1,792 | $9,088 | $643 | $8,445 |
| 2023 | $1,617 | $8,214 | $581 | $7,633 |
| 2022 | $1,475 | $7,199 | $509 | $6,690 |
| 2021 | $1,537 | $6,821 | $482 | $6,339 |
| 2020 | $256 | $7,144 | $505 | $6,639 |
| 2019 | $262 | $7,144 | $505 | $6,639 |
| 2018 | $281 | $7,248 | $512 | $6,736 |
| 2017 | $266 | $7,074 | $500 | $6,574 |
| 2016 | $334 | $7,059 | $498 | $6,561 |
| 2014 | $192 | $6,983 | $493 | $6,490 |
| 2013 | -- | $6,550 | $462 | $6,088 |
Source: Public Records
Map
Nearby Homes