Estimated Value: $546,000 - $702,000
1
Bed
1
Bath
1,586
Sq Ft
$402/Sq Ft
Est. Value
About This Home
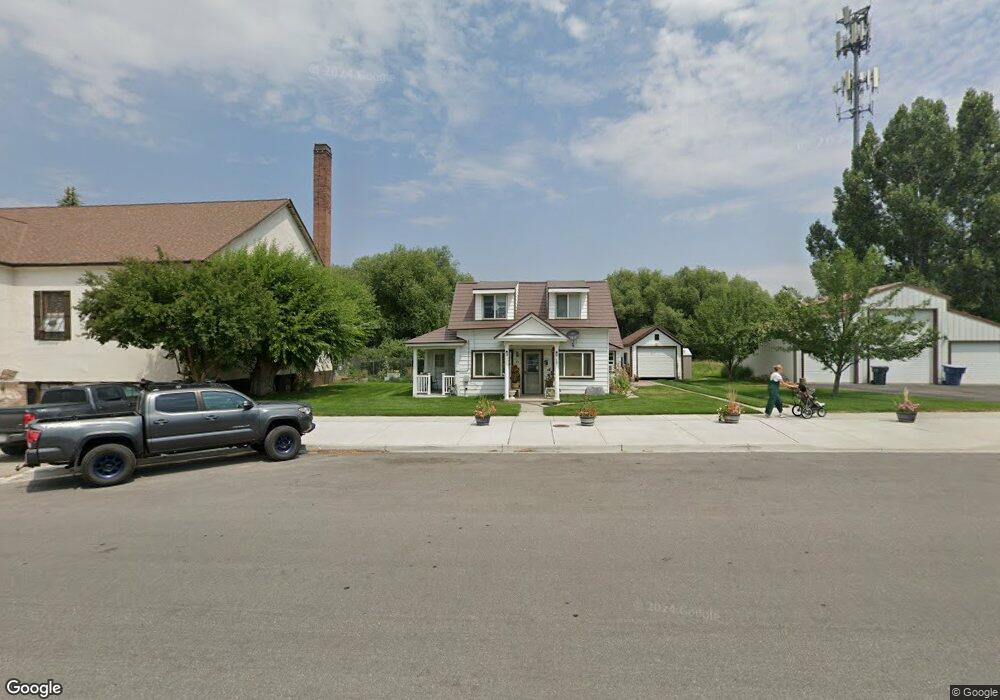
This home is located at 19 E 100 S, Kamas, UT 84036 and is currently estimated at $637,106, approximately $401 per square foot. 19 E 100 S is a home located in Summit County with nearby schools including South Summit Elementary School and South Summit High School.
Ownership History
Date
Name
Owned For
Owner Type
Purchase Details
Closed on
Apr 29, 2005
Sold by
Crismon George E
Bought by
Crismon George E and Smith Orma J
Current Estimated Value
Home Financials for this Owner
Home Financials are based on the most recent Mortgage that was taken out on this home.
Original Mortgage
$92,000
Outstanding Balance
$47,276
Interest Rate
6.02%
Mortgage Type
New Conventional
Estimated Equity
$589,830
Purchase Details
Closed on
Apr 26, 2005
Sold by
Polichette David T
Bought by
Crisom George E
Home Financials for this Owner
Home Financials are based on the most recent Mortgage that was taken out on this home.
Original Mortgage
$92,000
Outstanding Balance
$47,276
Interest Rate
6.02%
Mortgage Type
New Conventional
Estimated Equity
$589,830
Create a Home Valuation Report for This Property
The Home Valuation Report is an in-depth analysis detailing your home's value as well as a comparison with similar homes in the area
Home Values in the Area
Average Home Value in this Area
Purchase History
| Date | Buyer | Sale Price | Title Company |
|---|---|---|---|
| Crismon George E | -- | None Available | |
| Crisom George E | -- | Founders Title Co |
Source: Public Records
Mortgage History
| Date | Status | Borrower | Loan Amount |
|---|---|---|---|
| Open | Crisom George E | $92,000 |
Source: Public Records
Tax History
| Year | Tax Paid | Tax Assessment Tax Assessment Total Assessment is a certain percentage of the fair market value that is determined by local assessors to be the total taxable value of land and additions on the property. | Land | Improvement |
|---|---|---|---|---|
| 2025 | $1,770 | $304,550 | $98,175 | $206,375 |
| 2024 | $1,716 | $299,875 | $93,500 | $206,375 |
| 2023 | $1,716 | $299,875 | $93,500 | $206,375 |
| 2022 | $1,605 | $248,721 | $71,500 | $177,221 |
| 2021 | $1,205 | $149,284 | $36,850 | $112,434 |
| 2020 | $1,278 | $146,045 | $36,850 | $109,195 |
| 2019 | $1,312 | $134,707 | $36,850 | $97,857 |
| 2018 | $1,169 | $124,989 | $36,850 | $88,139 |
| 2017 | $974 | $105,921 | $27,500 | $78,421 |
| 2016 | $1,021 | $105,921 | $27,500 | $78,421 |
| 2015 | $960 | $97,186 | $0 | $0 |
| 2013 | $1,024 | $97,186 | $0 | $0 |
Source: Public Records
Map
Nearby Homes
- 3696 E Huntley Way Unit 64
- 182 E 160 S Unit 10
- 342 S 125 W
- 0 Utah 248
- 325 N Main St
- 858 Crabapple Ct
- 352 E 340 S
- 354 E 370 S
- 155 Hawthorne Dr
- 595 S Main St Unit 10
- 595 S Main St Unit 18
- 1090 Wasatch View Dr Unit 16
- 883 Wasatch View Dr Unit 11
- 886 Wasatch View Dr Unit 12
- 1156 Wasatch View Dr Unit 17
- 430 E 600 S
- 1228 Wasatch View Dr Unit 18
- 455 Thorn Creek Dr
- 250 W Simpson Ln
- 846 E 270 S
Your Personal Tour Guide
Ask me questions while you tour the home.