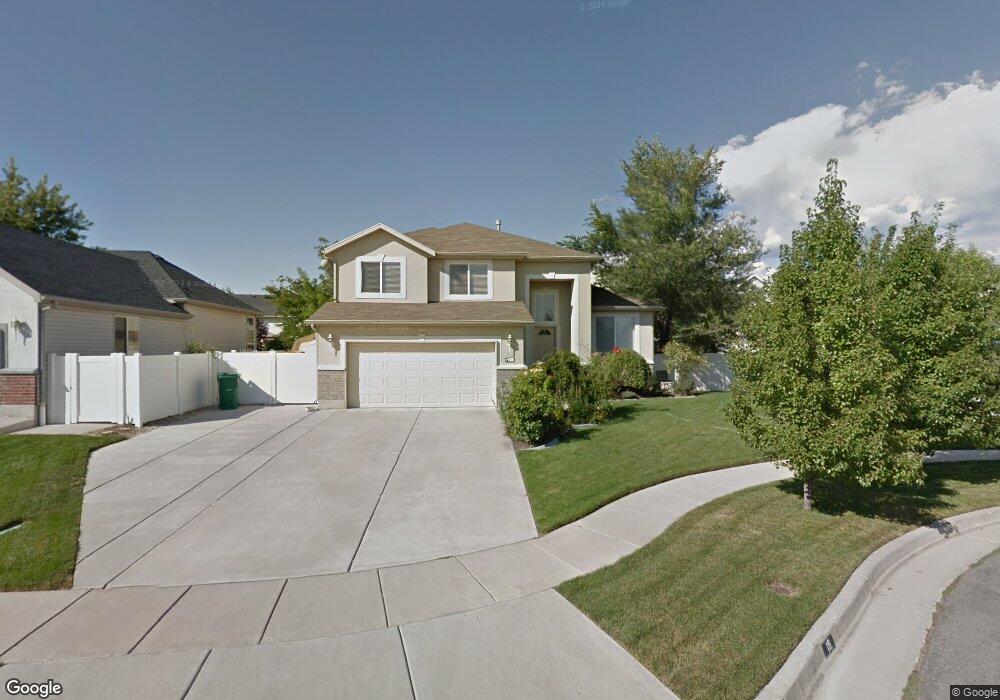
19 E 2200 N Layton, UT 84041
Estimated Value: $516,000 - $609,000
5
Beds
4
Baths
2,732
Sq Ft
$205/Sq Ft
Est. Value
About This Home
This home is located at 19 E 2200 N, Layton, UT 84041 and is currently estimated at $559,914, approximately $204 per square foot. 19 E 2200 N is a home located in Davis County with nearby schools including Lincoln Elementary School, North Layton Junior High School, and Northridge High School.
Ownership History
Date
Name
Owned For
Owner Type
Purchase Details
Closed on
Jun 21, 2013
Sold by
Hansen Christopher P
Bought by
Hansen Chirstopher P and Hansen Chong Ae
Current Estimated Value
Home Financials for this Owner
Home Financials are based on the most recent Mortgage that was taken out on this home.
Original Mortgage
$169,771
Outstanding Balance
$120,711
Interest Rate
3.48%
Mortgage Type
VA
Estimated Equity
$439,203
Purchase Details
Closed on
Sep 10, 2002
Sold by
Storey Paul C and Storey Tina H
Bought by
Hansen Christopher P
Purchase Details
Closed on
Jun 29, 2000
Sold by
Rainey Homes Inc
Bought by
Storey Paul C and Storey Tina H
Home Financials for this Owner
Home Financials are based on the most recent Mortgage that was taken out on this home.
Original Mortgage
$159,200
Interest Rate
7.62%
Create a Home Valuation Report for This Property
The Home Valuation Report is an in-depth analysis detailing your home's value as well as a comparison with similar homes in the area
Home Values in the Area
Average Home Value in this Area
Purchase History
| Date | Buyer | Sale Price | Title Company |
|---|---|---|---|
| Hansen Chirstopher P | -- | Mountain View Title | |
| Hansen Christopher P | -- | Backman Stewart Title Svcs | |
| Storey Paul C | -- | Heritage West Title Insuranc |
Source: Public Records
Mortgage History
| Date | Status | Borrower | Loan Amount |
|---|---|---|---|
| Open | Hansen Chirstopher P | $169,771 | |
| Previous Owner | Storey Paul C | $159,200 |
Source: Public Records
Tax History Compared to Growth
Tax History
| Year | Tax Paid | Tax Assessment Tax Assessment Total Assessment is a certain percentage of the fair market value that is determined by local assessors to be the total taxable value of land and additions on the property. | Land | Improvement |
|---|---|---|---|---|
| 2025 | $1,405 | $277,200 | $99,118 | $178,082 |
| 2024 | $1,309 | $265,650 | $115,664 | $149,986 |
| 2023 | $1,394 | $483,000 | $139,109 | $343,891 |
| 2022 | $2,020 | $270,050 | $73,071 | $196,979 |
| 2021 | $1,612 | $366,000 | $101,243 | $264,757 |
| 2020 | $1,352 | $319,000 | $85,715 | $233,285 |
| 2019 | $1,379 | $319,000 | $81,892 | $237,108 |
| 2018 | $1,223 | $295,000 | $81,892 | $213,108 |
| 2016 | $991 | $141,515 | $25,821 | $115,694 |
| 2015 | $2,051 | $136,620 | $25,821 | $110,799 |
| 2014 | $920 | $134,024 | $25,821 | $108,203 |
| 2013 | -- | $122,994 | $31,020 | $91,974 |
Source: Public Records
Map
Nearby Homes
- 23 E 2150 N
- 9 W 2150 N
- 2048 Evans Cove Loop
- 2044 Evans Cove Loop
- 95 W 2400 N
- 2053 Evans Cove Loop Unit 39
- 2500 N Fort Ln Unit 189
- 2500 N Fort Ln Unit 238
- 2600 N Hill Field Rd Unit 4
- 1908 N 200 W
- 2248 N 500 W
- 506 W 2200 N
- 2211 N 525 W
- 265 Mindella Way
- 414 E 2625 N
- 14 Lakeview Dr
- 254 Fremont Way
- 241 Fremont Way
- 203 Darlington Way
- 202 Darlington Way