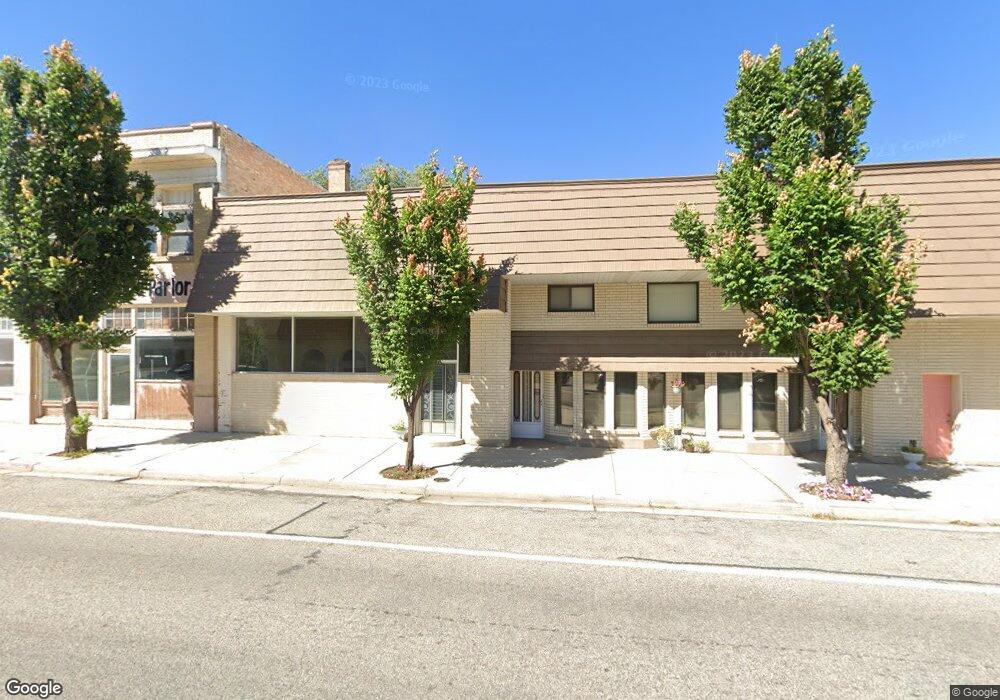
19 E Factory St Garland, UT 84312
Estimated Value: $517,000 - $701,000
6
Beds
4
Baths
3,855
Sq Ft
$153/Sq Ft
Est. Value
About This Home
This home is located at 19 E Factory St, Garland, UT 84312 and is currently estimated at $589,452, approximately $152 per square foot. 19 E Factory St is a home with nearby schools including Fielding School, Bear River Middle School, and Alice C. Harris Intermediate School.
Ownership History
Date
Name
Owned For
Owner Type
Purchase Details
Closed on
Sep 28, 2018
Sold by
Deakin Tamira C
Bought by
Campbell Deakin Brent Owen and Campbell Deakin Tamira
Current Estimated Value
Purchase Details
Closed on
Jun 21, 2017
Sold by
Deakin Tamira Campbell
Bought by
Deakin Tamira C
Purchase Details
Closed on
Nov 23, 2016
Sold by
Campbell Robert
Bought by
Campbell Robert Naf and Robert N Campbell Revocable Trust
Create a Home Valuation Report for This Property
The Home Valuation Report is an in-depth analysis detailing your home's value as well as a comparison with similar homes in the area
Home Values in the Area
Average Home Value in this Area
Purchase History
| Date | Buyer | Sale Price | Title Company |
|---|---|---|---|
| Campbell Deakin Brent Owen | -- | None Available | |
| Deakin Tamira C | -- | None Available | |
| Campbell Robert Naf | -- | None Available |
Source: Public Records
Tax History Compared to Growth
Tax History
| Year | Tax Paid | Tax Assessment Tax Assessment Total Assessment is a certain percentage of the fair market value that is determined by local assessors to be the total taxable value of land and additions on the property. | Land | Improvement |
|---|---|---|---|---|
| 2025 | $3,401 | $518,617 | $105,000 | $413,617 |
| 2024 | $3,090 | $530,445 | $100,000 | $430,445 |
| 2023 | $2,187 | $370,374 | $90,000 | $280,374 |
| 2022 | $1,999 | $317,452 | $16,117 | $301,335 |
| 2021 | $1,941 | $159,973 | $16,117 | $143,856 |
| 2020 | $1,151 | $159,973 | $16,117 | $143,856 |
| 2019 | $1,070 | $78,882 | $8,864 | $70,018 |
| 2018 | $1,113 | $76,673 | $6,655 | $70,018 |
| 2017 | $1,155 | $139,406 | $6,655 | $127,306 |
| 2016 | $1,087 | $73,339 | $6,655 | $66,684 |
| 2015 | $1,553 | $67,277 | $6,655 | $60,622 |
| 2014 | $1,553 | $100,196 | $6,655 | $93,541 |
| 2013 | -- | $100,196 | $6,655 | $93,541 |
Source: Public Records
Map
Nearby Homes
- 79 E Factory St
- 59 E Factory St
- 69 E Factory St
- 1385 S 1000 E
- 1372 S 1000 E
- 1385 S 1000 E Unit 1
- 15 N Main St
- 91 E Factory St
- 47 N Main St Unit 1
- 12 S Main St
- 111 E Factory St
- 48 W Factory St
- 63 S Main St
- 112 E Factory St
- 112 N Main St
- 62 W Factory St Unit 58
- 62 W Factory St
- 121 E 100 N
- 137 E Factory St
- 36 N 100 W