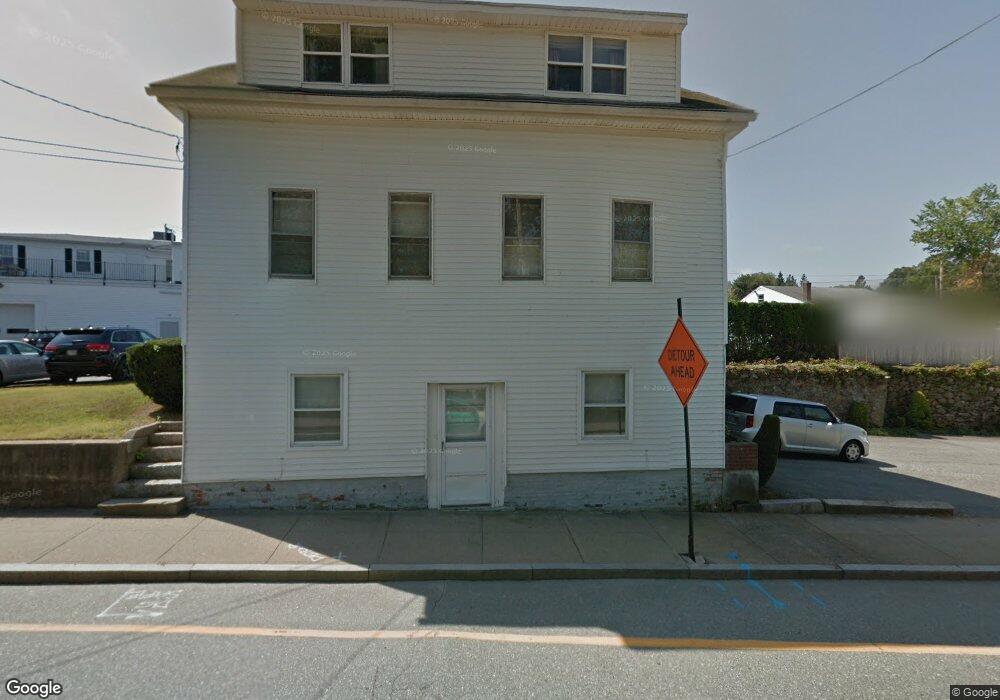
19 E Main St West Warwick, RI 02893
West Warwick Centre NeighborhoodEstimated Value: $1,165,400
5
Beds
3
Baths
1,568
Sq Ft
$743/Sq Ft
Est. Value
About This Home
This home is located at 19 E Main St, West Warwick, RI 02893 and is currently estimated at $1,165,400, approximately $743 per square foot. 19 E Main St is a home located in Kent County with nearby schools including West Warwick High School, Islamic School of Rhode Island, and St Joseph School.
Ownership History
Date
Name
Owned For
Owner Type
Purchase Details
Closed on
Sep 10, 1999
Sold by
Damas Corp
Bought by
Mahmud Tariq
Current Estimated Value
Home Financials for this Owner
Home Financials are based on the most recent Mortgage that was taken out on this home.
Original Mortgage
$286,000
Outstanding Balance
$83,682
Interest Rate
7.65%
Mortgage Type
Commercial
Estimated Equity
$1,081,718
Create a Home Valuation Report for This Property
The Home Valuation Report is an in-depth analysis detailing your home's value as well as a comparison with similar homes in the area
Home Values in the Area
Average Home Value in this Area
Purchase History
| Date | Buyer | Sale Price | Title Company |
|---|---|---|---|
| Mahmud Tariq | $286,000 | -- | |
| Mahmud Tariq | $286,000 | -- |
Source: Public Records
Mortgage History
| Date | Status | Borrower | Loan Amount |
|---|---|---|---|
| Open | Mahmud Tariq | $15,000 | |
| Open | Mahmud Tariq | $286,000 | |
| Closed | Mahmud Tariq | $286,000 |
Source: Public Records
Tax History Compared to Growth
Tax History
| Year | Tax Paid | Tax Assessment Tax Assessment Total Assessment is a certain percentage of the fair market value that is determined by local assessors to be the total taxable value of land and additions on the property. | Land | Improvement |
|---|---|---|---|---|
| 2025 | $7,311 | $290,100 | $47,900 | $242,200 |
| 2024 | $6,624 | $207,000 | $45,500 | $161,500 |
| 2023 | $6,494 | $207,000 | $45,500 | $161,500 |
| 2022 | $6,392 | $207,000 | $45,500 | $161,500 |
| 2021 | $5,565 | $171,600 | $44,600 | $127,000 |
| 2020 | $5,565 | $171,600 | $44,600 | $127,000 |
| 2019 | $5,460 | $171,600 | $44,600 | $127,000 |
| 2018 | $3,537 | $106,600 | $44,400 | $62,200 |
| 2017 | $3,424 | $106,600 | $44,400 | $62,200 |
| 2016 | $3,362 | $106,600 | $44,400 | $62,200 |
| 2015 | $3,563 | $95,600 | $39,200 | $56,400 |
| 2014 | $3,485 | $95,600 | $39,200 | $56,400 |
Source: Public Records
Map
Nearby Homes