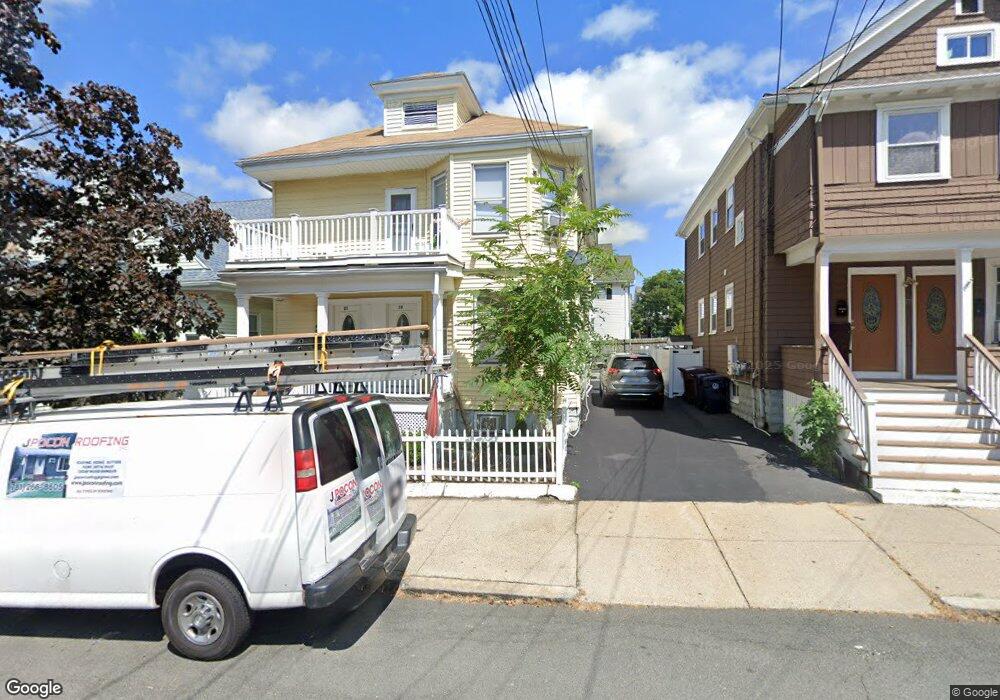
19 Edith St Everett, MA 02149
Glendale NeighborhoodEstimated Value: $704,557 - $833,000
4
Beds
2
Baths
1,760
Sq Ft
$438/Sq Ft
Est. Value
About This Home
This home is located at 19 Edith St, Everett, MA 02149 and is currently estimated at $770,389, approximately $437 per square foot. 19 Edith St is a home located in Middlesex County with nearby schools including Everett High School and Pioneer Charter School of Science.
Ownership History
Date
Name
Owned For
Owner Type
Purchase Details
Closed on
Oct 11, 1996
Sold by
Merenda John and Merenda Sandra A
Bought by
Buonopane Stephen A and Ardolino Lauri A
Current Estimated Value
Home Financials for this Owner
Home Financials are based on the most recent Mortgage that was taken out on this home.
Original Mortgage
$100,000
Outstanding Balance
$9,157
Interest Rate
8.06%
Mortgage Type
Purchase Money Mortgage
Estimated Equity
$761,232
Create a Home Valuation Report for This Property
The Home Valuation Report is an in-depth analysis detailing your home's value as well as a comparison with similar homes in the area
Home Values in the Area
Average Home Value in this Area
Purchase History
| Date | Buyer | Sale Price | Title Company |
|---|---|---|---|
| Buonopane Stephen A | $127,000 | -- |
Source: Public Records
Mortgage History
| Date | Status | Borrower | Loan Amount |
|---|---|---|---|
| Open | Buonopane Stephen A | $100,000 |
Source: Public Records
Tax History
| Year | Tax Paid | Tax Assessment Tax Assessment Total Assessment is a certain percentage of the fair market value that is determined by local assessors to be the total taxable value of land and additions on the property. | Land | Improvement |
|---|---|---|---|---|
| 2025 | $7,727 | $678,400 | $237,100 | $441,300 |
| 2024 | $7,044 | $614,700 | $207,800 | $406,900 |
| 2023 | $6,880 | $584,000 | $198,700 | $385,300 |
| 2022 | $5,183 | $500,300 | $189,700 | $310,600 |
| 2021 | $4,628 | $468,900 | $169,800 | $299,100 |
| 2020 | $4,878 | $458,500 | $169,800 | $288,700 |
| 2019 | $5,166 | $417,300 | $161,700 | $255,600 |
| 2018 | $5,067 | $367,700 | $140,900 | $226,800 |
| 2017 | $4,846 | $335,600 | $126,500 | $209,100 |
| 2016 | $4,342 | $300,500 | $112,900 | $187,600 |
| 2015 | $4,056 | $277,600 | $101,800 | $175,800 |
Source: Public Records
Map
Nearby Homes
- 859 Broadway Unit 15
- 881 Broadway Unit 44
- 13 Coolidge St
- 132 Vernal St
- 53 Sycamore St
- 5 Mason St
- 21 Hillside Ave Unit 21
- 19 Mills St
- 44 Walnut St
- 21 Central Ave Unit 10
- 21 Staples Ave Unit 26
- 15 Staples Ave Unit 45
- 15 Staples Ave Unit 31
- 51 Adams Ave
- 20 Fairmount St
- 272-274 Cross St Unit 4
- 272-274 Cross St Unit 3
- 112 Hadley St
- 211 Elm St
- 210 Hancock St
Your Personal Tour Guide
Ask me questions while you tour the home.