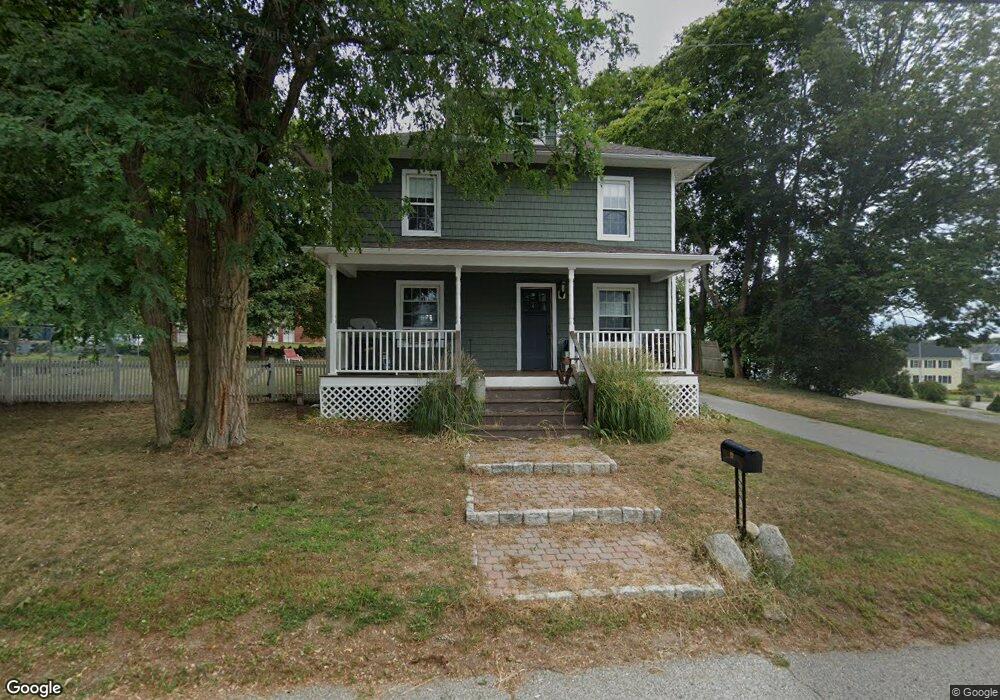
19 Edward St Coventry, RI 02816
West Warwick Centre NeighborhoodEstimated Value: $325,000 - $412,000
3
Beds
2
Baths
1,704
Sq Ft
$227/Sq Ft
Est. Value
About This Home
This home is located at 19 Edward St, Coventry, RI 02816 and is currently estimated at $386,954, approximately $227 per square foot. 19 Edward St is a home located in Kent County with nearby schools including Alan Shawn Feinstein Ms Of Cov, Coventry High School, and Father John V. Doyle School.
Ownership History
Date
Name
Owned For
Owner Type
Purchase Details
Closed on
Aug 15, 2017
Sold by
Power Realty
Bought by
Shalvey Ryan C
Current Estimated Value
Home Financials for this Owner
Home Financials are based on the most recent Mortgage that was taken out on this home.
Original Mortgage
$110,248
Outstanding Balance
$90,902
Interest Rate
3.88%
Mortgage Type
Purchase Money Mortgage
Estimated Equity
$296,052
Purchase Details
Closed on
Jan 6, 2017
Sold by
Department Of Housing & Urban Dev
Bought by
Citizens Bank
Purchase Details
Closed on
Nov 13, 2015
Sold by
Citizens Bank
Bought by
Department Of Housing & Urban Dev
Purchase Details
Closed on
Jun 24, 2015
Sold by
Dupre Erica
Bought by
Citizens Bank
Purchase Details
Closed on
Dec 22, 2011
Sold by
Dupre Marc and Dupre Erica
Bought by
Dupre Marc
Purchase Details
Closed on
May 25, 2007
Sold by
Mtglq Investors
Bought by
Dupre Marc and Dupre Erica
Home Financials for this Owner
Home Financials are based on the most recent Mortgage that was taken out on this home.
Original Mortgage
$216,601
Interest Rate
6.27%
Mortgage Type
Purchase Money Mortgage
Purchase Details
Closed on
Feb 24, 2005
Sold by
Simone Stacy
Bought by
Heron Joseph P
Purchase Details
Closed on
Jun 14, 2002
Sold by
Est Cwick Albin and Saunders Linda L
Bought by
Rathbun Donna L
Create a Home Valuation Report for This Property
The Home Valuation Report is an in-depth analysis detailing your home's value as well as a comparison with similar homes in the area
Home Values in the Area
Average Home Value in this Area
Purchase History
| Date | Buyer | Sale Price | Title Company |
|---|---|---|---|
| Shalvey Ryan C | $137,810 | -- | |
| Citizens Bank | -- | -- | |
| Department Of Housing & Urban Dev | -- | -- | |
| Citizens Bank | $104,400 | -- | |
| Dupre Marc | -- | -- | |
| Dupre Marc | $220,000 | -- | |
| Heron Joseph P | $274,500 | -- | |
| Rathbun Donna L | $45,000 | -- |
Source: Public Records
Mortgage History
| Date | Status | Borrower | Loan Amount |
|---|---|---|---|
| Open | Shalvey Ryan C | $110,248 | |
| Previous Owner | Rathbun Donna L | $213,582 | |
| Previous Owner | Rathbun Donna L | $216,601 |
Source: Public Records
Tax History
| Year | Tax Paid | Tax Assessment Tax Assessment Total Assessment is a certain percentage of the fair market value that is determined by local assessors to be the total taxable value of land and additions on the property. | Land | Improvement |
|---|---|---|---|---|
| 2025 | $4,676 | $290,600 | $88,500 | $202,100 |
| 2024 | $4,603 | $290,600 | $88,500 | $202,100 |
| 2023 | $4,455 | $290,600 | $88,500 | $202,100 |
| 2022 | $3,822 | $195,300 | $84,700 | $110,600 |
| 2021 | $3,789 | $195,300 | $84,700 | $110,600 |
| 2020 | $4,343 | $195,300 | $84,700 | $110,600 |
| 2019 | $3,856 | $173,400 | $68,000 | $105,400 |
| 2018 | $3,747 | $173,400 | $68,000 | $105,400 |
| 2017 | $3,638 | $173,400 | $68,000 | $105,400 |
| 2016 | $3,830 | $178,900 | $59,300 | $119,600 |
| 2015 | $3,726 | $178,900 | $59,300 | $119,600 |
| 2014 | $3,649 | $178,900 | $59,300 | $119,600 |
| 2013 | $3,456 | $185,200 | $66,200 | $119,000 |
Source: Public Records
Map
Nearby Homes
- 123 Doolittle St
- 58 Read Ave
- 87 Bates Ave
- 31 Anthony St Unit 33
- 27 Matteson St
- 32 Pilgrim Ave
- 0 Beaulieu Ave
- 2 Ritchotte Ct
- 91 Windsor Park Dr
- 37 West St
- 37 Phillip St
- 22 Wood St
- 11 Wood St
- 176 Archambault Ave
- 54 Arthur St
- 131 Pawtuxet Terrace
- 1 Pettine St
- 152 Brookside Ave
- 9 Regent St Unit 11
- 168 Knotty Oak Rd
Your Personal Tour Guide
Ask me questions while you tour the home.