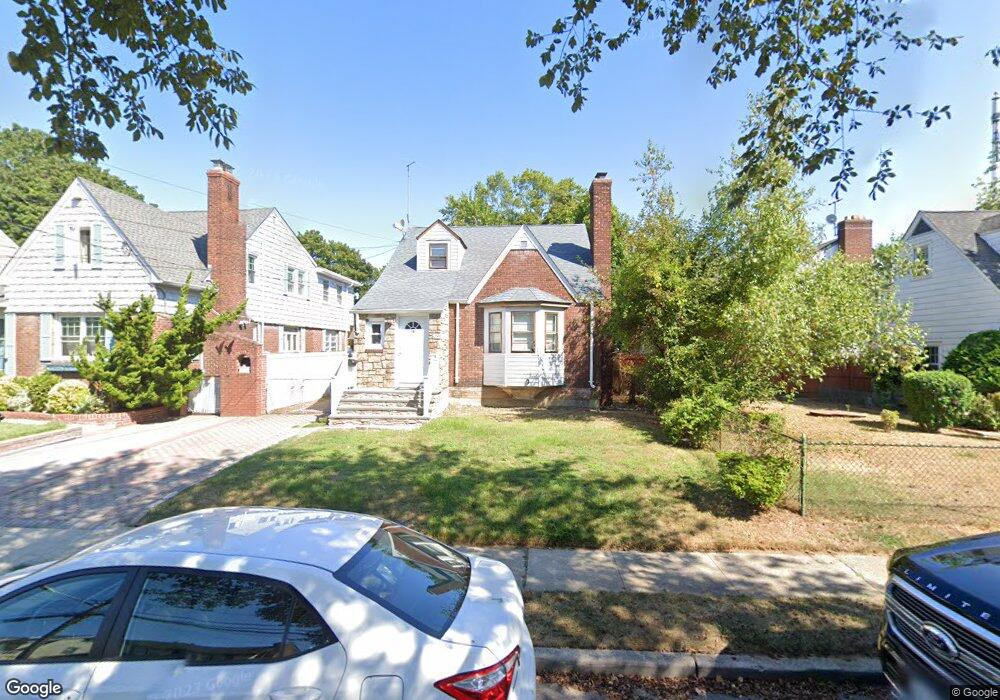
19 Edward St Lynbrook, NY 11563
Estimated Value: $678,000 - $746,447
Studio
2
Baths
1,419
Sq Ft
$502/Sq Ft
Est. Value
About This Home
This home is located at 19 Edward St, Lynbrook, NY 11563 and is currently estimated at $712,224, approximately $501 per square foot. 19 Edward St is a home located in Nassau County with nearby schools including Davison Avenue Intermediate School, Maurice W. Downing Primary K-2 School, and Howard T Herber Middle School.
Ownership History
Date
Name
Owned For
Owner Type
Purchase Details
Closed on
Nov 14, 1997
Sold by
Madonna Christephen
Bought by
Dowd Thomas and Dowd Sara
Current Estimated Value
Purchase Details
Closed on
Jun 30, 1995
Sold by
Manise Anne
Bought by
Madonna Christopher and Madonna Mary
Home Financials for this Owner
Home Financials are based on the most recent Mortgage that was taken out on this home.
Original Mortgage
$173,850
Interest Rate
7.84%
Create a Home Valuation Report for This Property
The Home Valuation Report is an in-depth analysis detailing your home's value as well as a comparison with similar homes in the area
Home Values in the Area
Average Home Value in this Area
Purchase History
| Date | Buyer | Sale Price | Title Company |
|---|---|---|---|
| Dowd Thomas | $200,000 | -- | |
| Madonna Christopher | $183,000 | -- |
Source: Public Records
Mortgage History
| Date | Status | Borrower | Loan Amount |
|---|---|---|---|
| Previous Owner | Madonna Christopher | $173,850 |
Source: Public Records
Tax History
| Year | Tax Paid | Tax Assessment Tax Assessment Total Assessment is a certain percentage of the fair market value that is determined by local assessors to be the total taxable value of land and additions on the property. | Land | Improvement |
|---|---|---|---|---|
| 2025 | $13,642 | $499 | $185 | $314 |
| 2024 | $3,571 | $499 | $185 | $314 |
| 2023 | $11,163 | $499 | $185 | $314 |
| 2022 | $11,163 | $498 | $185 | $313 |
| 2021 | $11,109 | $470 | $174 | $296 |
| 2020 | $8,949 | $630 | $423 | $207 |
| 2019 | $9,954 | $630 | $423 | $207 |
| 2018 | $9,287 | $630 | $0 | $0 |
| 2017 | $5,587 | $630 | $406 | $224 |
| 2016 | $8,357 | $630 | $406 | $224 |
| 2015 | $2,637 | $637 | $423 | $214 |
| 2014 | $2,637 | $637 | $423 | $214 |
| 2013 | $2,478 | $637 | $423 | $214 |
Source: Public Records
Map
Nearby Homes
- 64 Hodson Ave
- 40 Hendrickson Ave
- 42 Hendrickson Ave
- 90 Pearsall Ave
- 32 Franklin Ave
- 63 Central Ave
- 127 Smith St
- 157 Hempstead Ave Unit B20
- 29 Summit Ave
- 72 Cedar Rd
- 181 Walnut St
- 17 Oxford St
- 25 Centre St
- 57 Nieman Ave
- 75 Noble St Unit 126
- 75 Noble St Unit 121
- 14 Hawthorne St
- 58 Chestnut St
- 205 Hempstead Ave
- 42 Driving Park Ave
Your Personal Tour Guide
Ask me questions while you tour the home.