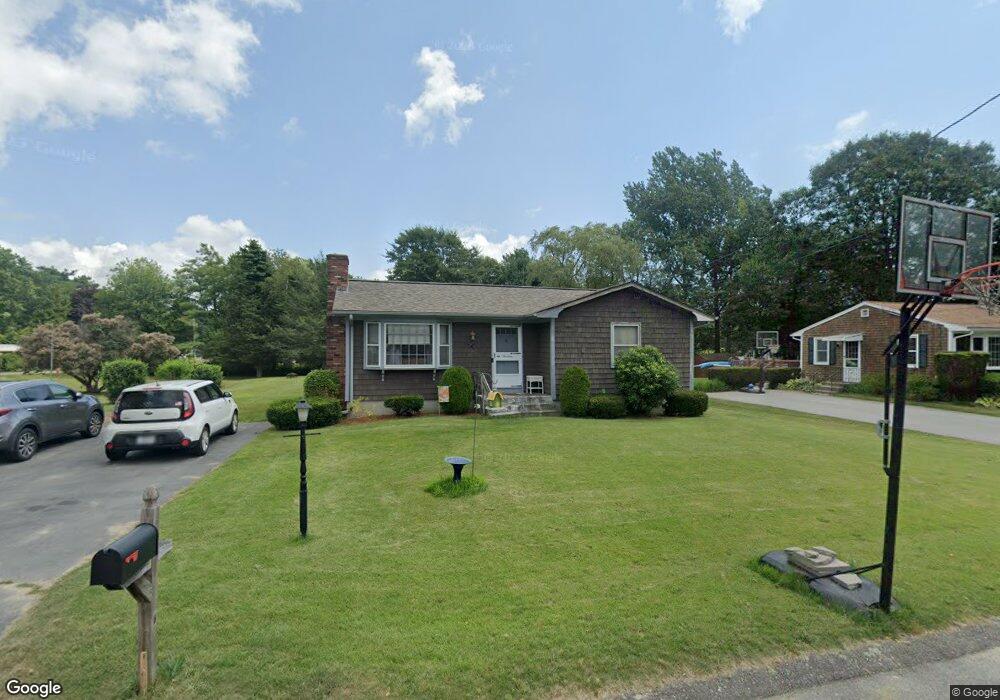
19 Elaine Way Acushnet, MA 02743
Estimated Value: $409,000 - $492,000
3
Beds
1
Bath
1,069
Sq Ft
$407/Sq Ft
Est. Value
About This Home
This home is located at 19 Elaine Way, Acushnet, MA 02743 and is currently estimated at $435,073, approximately $406 per square foot. 19 Elaine Way is a home located in Bristol County with nearby schools including Acushnet Elementary School, Albert F Ford Middle School, and Alma Del Mar Charter School.
Ownership History
Date
Name
Owned For
Owner Type
Purchase Details
Closed on
Sep 1, 2006
Sold by
Hinckley Evelyn W
Bought by
Kwiecian Heather and Kwiecian Michael A
Current Estimated Value
Home Financials for this Owner
Home Financials are based on the most recent Mortgage that was taken out on this home.
Original Mortgage
$200,000
Outstanding Balance
$121,151
Interest Rate
6.83%
Mortgage Type
Purchase Money Mortgage
Estimated Equity
$313,922
Create a Home Valuation Report for This Property
The Home Valuation Report is an in-depth analysis detailing your home's value as well as a comparison with similar homes in the area
Home Values in the Area
Average Home Value in this Area
Purchase History
| Date | Buyer | Sale Price | Title Company |
|---|---|---|---|
| Kwiecian Heather | $250,000 | -- |
Source: Public Records
Mortgage History
| Date | Status | Borrower | Loan Amount |
|---|---|---|---|
| Open | Kwiecian Heather | $200,000 | |
| Closed | Kwiecian Heather | $37,500 |
Source: Public Records
Tax History Compared to Growth
Tax History
| Year | Tax Paid | Tax Assessment Tax Assessment Total Assessment is a certain percentage of the fair market value that is determined by local assessors to be the total taxable value of land and additions on the property. | Land | Improvement |
|---|---|---|---|---|
| 2025 | $36 | $333,600 | $124,600 | $209,000 |
| 2024 | $3,501 | $306,800 | $118,100 | $188,700 |
| 2023 | $3,380 | $281,700 | $107,100 | $174,600 |
| 2022 | $3,357 | $253,000 | $100,600 | $152,400 |
| 2021 | $2,995 | $234,800 | $100,600 | $134,200 |
| 2020 | $3,181 | $228,200 | $94,000 | $134,200 |
| 2019 | $3,044 | $214,700 | $89,600 | $125,100 |
| 2018 | $2,652 | $204,300 | $89,600 | $114,700 |
| 2017 | $2,845 | $197,000 | $89,600 | $107,400 |
| 2016 | $2,767 | $190,400 | $89,600 | $100,800 |
| 2015 | $2,626 | $183,900 | $89,600 | $94,300 |
Source: Public Records
Map
Nearby Homes