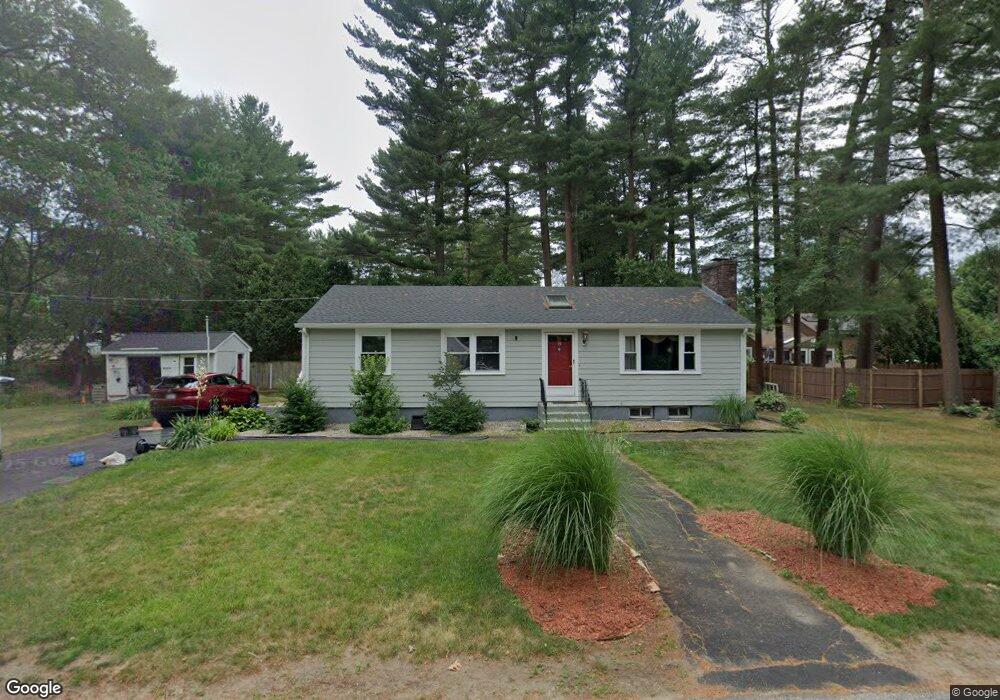
19 Elliot St Sharon, MA 02067
Estimated Value: $486,000 - $657,259
3
Beds
2
Baths
1,351
Sq Ft
$448/Sq Ft
Est. Value
About This Home
This home is located at 19 Elliot St, Sharon, MA 02067 and is currently estimated at $605,315, approximately $448 per square foot. 19 Elliot St is a home located in Norfolk County with nearby schools including Heights Elementary School, Sharon Middle School, and Sharon High School.
Ownership History
Date
Name
Owned For
Owner Type
Purchase Details
Closed on
May 14, 1999
Sold by
Department Of Housing & Urban Dev
Bought by
Karraz Toufic and Karraz Yola
Current Estimated Value
Home Financials for this Owner
Home Financials are based on the most recent Mortgage that was taken out on this home.
Original Mortgage
$104,000
Interest Rate
6.92%
Mortgage Type
Purchase Money Mortgage
Purchase Details
Closed on
Sep 25, 1998
Sold by
Mccarthy Richard J Est
Bought by
First Union Mtg Corp
Purchase Details
Closed on
Nov 8, 1995
Sold by
Boyd Gloria J
Bought by
Mccarthy Richard J
Home Financials for this Owner
Home Financials are based on the most recent Mortgage that was taken out on this home.
Original Mortgage
$129,150
Interest Rate
7.62%
Mortgage Type
Purchase Money Mortgage
Create a Home Valuation Report for This Property
The Home Valuation Report is an in-depth analysis detailing your home's value as well as a comparison with similar homes in the area
Home Values in the Area
Average Home Value in this Area
Purchase History
| Date | Buyer | Sale Price | Title Company |
|---|---|---|---|
| Karraz Toufic | $130,259 | -- | |
| First Union Mtg Corp | $159,802 | -- | |
| Mccarthy Richard J | $131,000 | -- |
Source: Public Records
Mortgage History
| Date | Status | Borrower | Loan Amount |
|---|---|---|---|
| Closed | Mccarthy Richard J | $135,000 | |
| Closed | Mccarthy Richard J | $104,000 | |
| Previous Owner | Mccarthy Richard J | $129,150 |
Source: Public Records
Tax History Compared to Growth
Tax History
| Year | Tax Paid | Tax Assessment Tax Assessment Total Assessment is a certain percentage of the fair market value that is determined by local assessors to be the total taxable value of land and additions on the property. | Land | Improvement |
|---|---|---|---|---|
| 2025 | $9,228 | $527,900 | $358,300 | $169,600 |
| 2024 | $8,837 | $502,700 | $328,700 | $174,000 |
| 2023 | $8,642 | $464,900 | $307,200 | $157,700 |
| 2022 | $8,285 | $419,500 | $256,000 | $163,500 |
| 2021 | $8,186 | $400,700 | $241,500 | $159,200 |
| 2020 | $7,613 | $400,700 | $241,500 | $159,200 |
| 2019 | $7,261 | $374,100 | $213,700 | $160,400 |
| 2018 | $7,167 | $370,000 | $209,600 | $160,400 |
| 2017 | $6,989 | $356,200 | $195,800 | $160,400 |
| 2016 | $6,882 | $342,200 | $195,800 | $146,400 |
| 2015 | $6,403 | $315,400 | $179,700 | $135,700 |
| 2014 | $6,227 | $303,000 | $178,000 | $125,000 |
Source: Public Records
Map
Nearby Homes