

19 Elm St Hinesville, GA 31313
3
Beds
1.5
Baths
1,250
Sq Ft
0.78
Acres
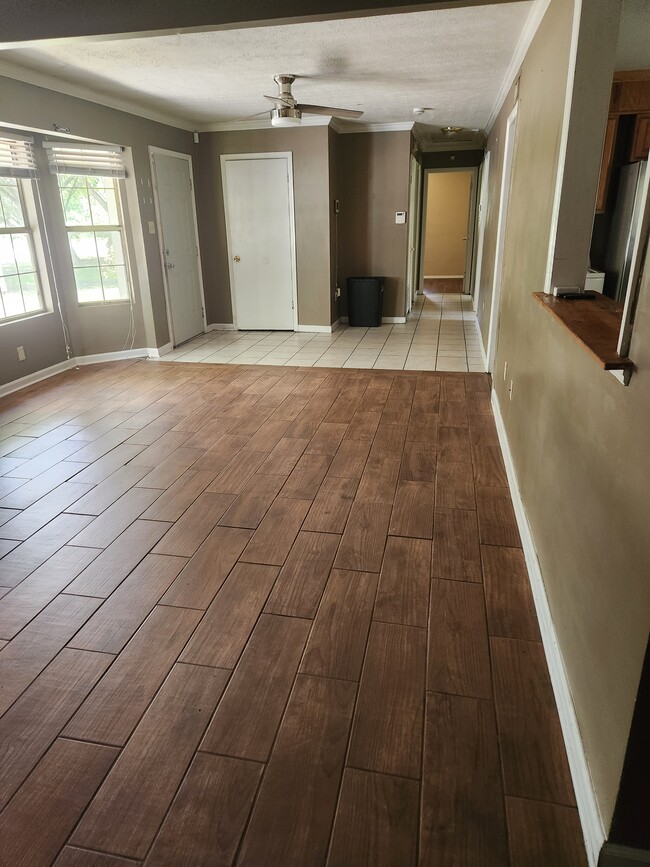
About This Home
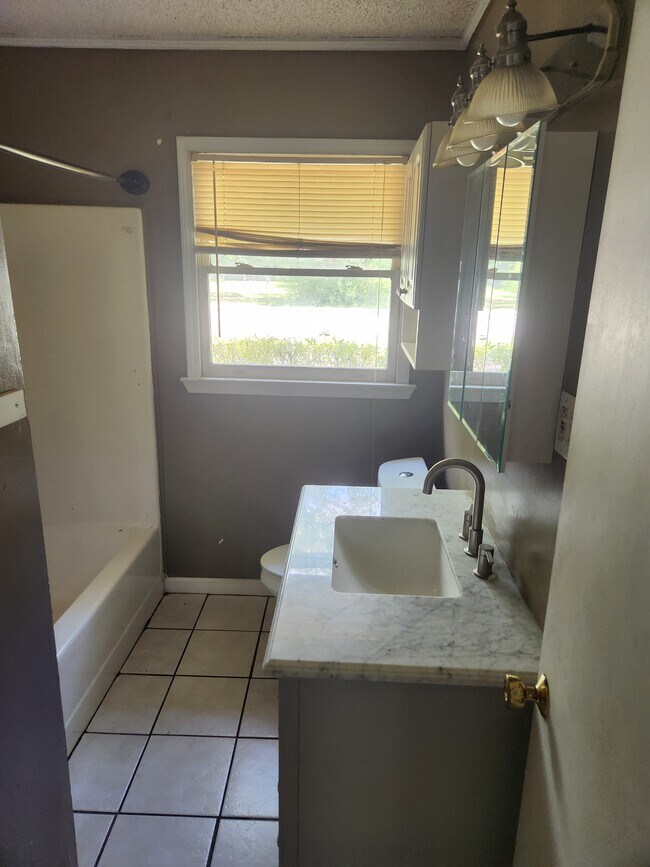
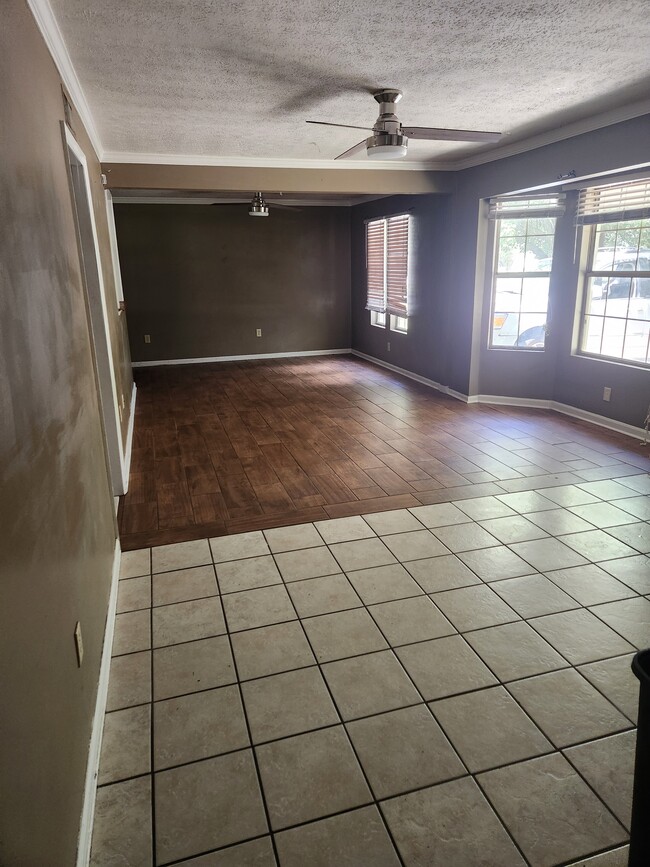
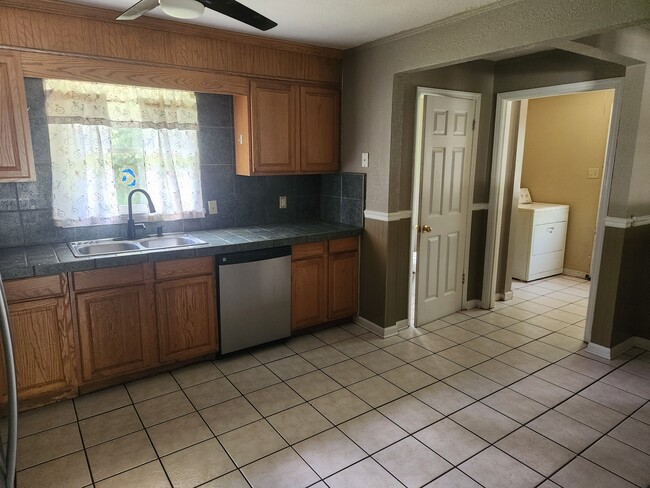
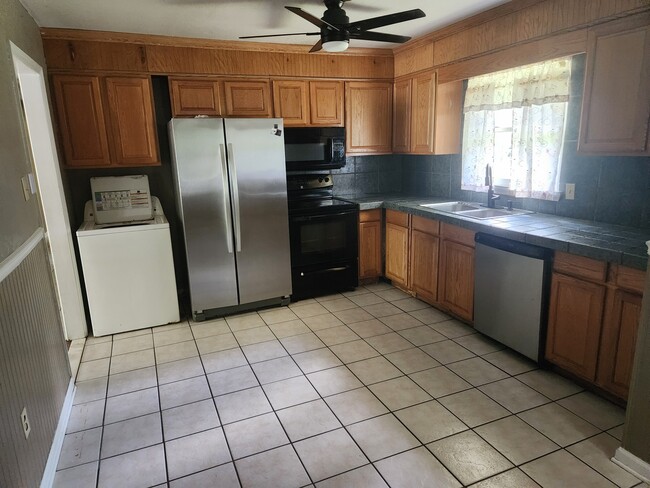
3 bedroom 1.5 bathroom Bruck home near Ft Stewart. Fenced in back yard.
Listing Provided By

Map
Property History
| Date | Event | Price | List to Sale | Price per Sq Ft |
|---|---|---|---|---|
| 11/21/2025 11/21/25 | Price Changed | $1,550 | 0.0% | $1 / Sq Ft |
| 11/21/2025 11/21/25 | For Rent | $1,550 | -6.1% | -- |
| 09/03/2025 09/03/25 | Off Market | $1,650 | -- | -- |
| 07/28/2025 07/28/25 | For Rent | $1,650 | -- | -- |
Nearby Homes
- 193 Heirloom Rd
- 841 Willowbrook Dr
- 664 Windward Dr
- 817 Lesa St
- 727 S Main St
- 942 Gulfstream Rd
- 646 Fleming Rd
- 705 Edgewood Ct
- 784 Inwood Dr
- 134 Pointe Dr S
- 910 Berkshire Terrace
- 412 Timberlane Cir Unit B
- 906 W Pine St
- 910 Brett Dr
- 910 Brett Dr
- 129 Rolland St
- 939 S Main St
- 106 S Commerce St
- 979 Live Oak Dr
- 350 Beverly St