Estimated Value: $611,000 - $656,000
8
Beds
4
Baths
2,500
Sq Ft
$255/Sq Ft
Est. Value
About This Home
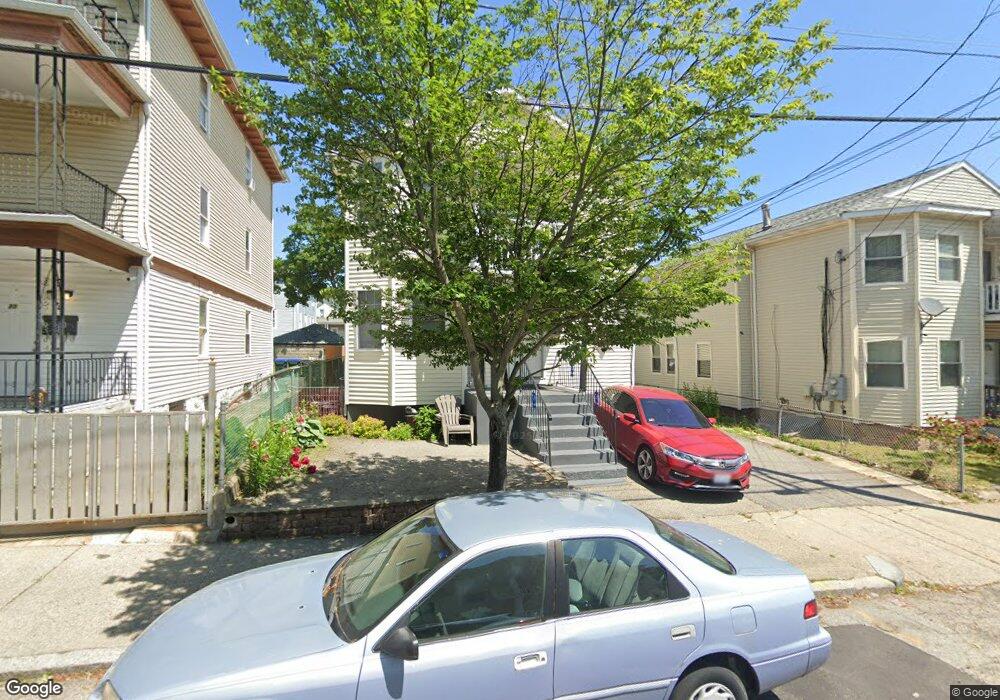
This home is located at 19 Elma St, Providence, RI 02905 and is currently estimated at $636,599, approximately $254 per square foot. 19 Elma St is a home located in Providence County with nearby schools including Asa Messer Elementary School, Charles N. Fortes Elementary School, and Robert L. Bailey IV Elementary.
Ownership History
Date
Name
Owned For
Owner Type
Purchase Details
Closed on
Apr 14, 2006
Sold by
Sand Inv Team
Bought by
Aybar Josefina
Current Estimated Value
Home Financials for this Owner
Home Financials are based on the most recent Mortgage that was taken out on this home.
Original Mortgage
$327,750
Outstanding Balance
$186,432
Interest Rate
6.28%
Mortgage Type
Purchase Money Mortgage
Estimated Equity
$450,167
Purchase Details
Closed on
Dec 21, 2004
Sold by
Nieves Yolanda and Carbuccia Manuel
Bought by
Nieves Yolanda and Valentin Luis J
Create a Home Valuation Report for This Property
The Home Valuation Report is an in-depth analysis detailing your home's value as well as a comparison with similar homes in the area
Home Values in the Area
Average Home Value in this Area
Purchase History
| Date | Buyer | Sale Price | Title Company |
|---|---|---|---|
| Aybar Josefina | $345,000 | -- | |
| Nieves Yolanda | $10,000 | -- |
Source: Public Records
Mortgage History
| Date | Status | Borrower | Loan Amount |
|---|---|---|---|
| Open | Nieves Yolanda | $327,750 | |
| Previous Owner | Nieves Yolanda | $130,000 |
Source: Public Records
Tax History Compared to Growth
Tax History
| Year | Tax Paid | Tax Assessment Tax Assessment Total Assessment is a certain percentage of the fair market value that is determined by local assessors to be the total taxable value of land and additions on the property. | Land | Improvement |
|---|---|---|---|---|
| 2025 | $4,177 | $553,300 | $119,700 | $433,600 |
| 2024 | $7,204 | $392,600 | $75,800 | $316,800 |
| 2023 | $7,204 | $392,600 | $75,800 | $316,800 |
| 2022 | $6,988 | $392,600 | $75,800 | $316,800 |
| 2021 | $5,948 | $242,200 | $33,500 | $208,700 |
| 2020 | $5,948 | $242,200 | $33,500 | $208,700 |
| 2019 | $5,948 | $242,200 | $33,500 | $208,700 |
| 2018 | $5,513 | $172,500 | $30,400 | $142,100 |
| 2017 | $5,513 | $172,500 | $30,400 | $142,100 |
| 2016 | $5,513 | $172,500 | $30,400 | $142,100 |
| 2015 | $4,945 | $149,400 | $30,400 | $119,000 |
| 2014 | $5,042 | $149,400 | $30,400 | $119,000 |
| 2013 | $5,042 | $149,400 | $30,400 | $119,000 |
Source: Public Records
Map
Nearby Homes
- 20 Pennsylvania Ave
- 6 Warrington St
- 150 Early St
- 222 Pavilion Ave
- 153 Byfield St
- 51 Detroit Ave
- 133 Byfield St
- 199 Gallup St
- 98 Sackett St
- 33 Adelaide Ave
- 8 Atlantic Ave
- 136 Houston St
- 143 Houston St
- 17 Plum St
- 35 Nebraska St
- 76 Adelaide Ave
- 104 Miner St
- 226 Oxford St
- 186 Oxford St
- 154 Gallatin St Unit 156