Estimated Value: $113,840 - $152,000
1
Bed
1
Bath
636
Sq Ft
$219/Sq Ft
Est. Value
About This Home
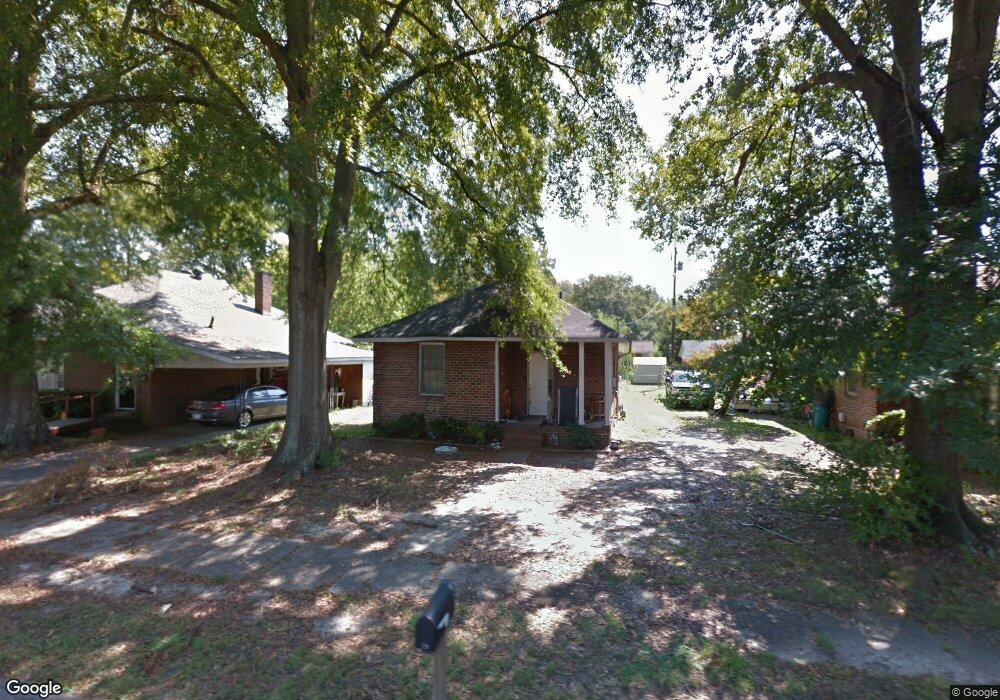
This home is located at 19 Elmwood St NE, Rome, GA 30161 and is currently estimated at $139,210, approximately $218 per square foot. 19 Elmwood St NE is a home located in Floyd County with nearby schools including Model Middle School, Model High School, and Unity Christian School.
Ownership History
Date
Name
Owned For
Owner Type
Purchase Details
Closed on
Jul 19, 2018
Sold by
Mcguire Steven R
Bought by
Cwj Properties Llc
Current Estimated Value
Purchase Details
Closed on
May 28, 2002
Sold by
Mcquire Steven R
Bought by
Mcguire Steven R
Purchase Details
Closed on
May 4, 1987
Sold by
Wood Ellen Mrs
Bought by
Mcquire Steven R
Purchase Details
Closed on
Mar 19, 1970
Sold by
Mcabee John Alton
Bought by
Wood Ellen Mrs
Purchase Details
Closed on
May 1, 1968
Sold by
Patrick Larry V
Bought by
Mcabee John Alton
Purchase Details
Closed on
Aug 29, 1967
Sold by
Patrick Vance S
Bought by
Patrick Larry V
Purchase Details
Closed on
Aug 29, 1966
Sold by
Barnett Mrs Clarence A
Bought by
Patrick Vance S
Purchase Details
Closed on
Jan 2, 1901
Sold by
Mahan Frances D
Bought by
Barnett Mrs Clarence A
Purchase Details
Closed on
Jan 1, 1901
Bought by
Mahan Frances D
Create a Home Valuation Report for This Property
The Home Valuation Report is an in-depth analysis detailing your home's value as well as a comparison with similar homes in the area
Home Values in the Area
Average Home Value in this Area
Purchase History
| Date | Buyer | Sale Price | Title Company |
|---|---|---|---|
| Cwj Properties Llc | $32,500 | -- | |
| Mcguire Steven R | -- | -- | |
| Mcquire Steven R | $14,000 | -- | |
| Wood Ellen Mrs | -- | -- | |
| Mcabee John Alton | -- | -- | |
| Patrick Larry V | $3,300 | -- | |
| Patrick Vance S | $3,800 | -- | |
| Barnett Mrs Clarence A | -- | -- | |
| Mahan Frances D | -- | -- |
Source: Public Records
Tax History Compared to Growth
Tax History
| Year | Tax Paid | Tax Assessment Tax Assessment Total Assessment is a certain percentage of the fair market value that is determined by local assessors to be the total taxable value of land and additions on the property. | Land | Improvement |
|---|---|---|---|---|
| 2024 | $1,057 | $32,719 | $9,071 | $23,648 |
| 2023 | $969 | $29,325 | $8,145 | $21,180 |
| 2022 | $689 | $22,108 | $6,664 | $15,444 |
| 2021 | $645 | $20,299 | $6,664 | $13,635 |
| 2020 | $574 | $17,835 | $5,091 | $12,744 |
| 2019 | $419 | $16,505 | $5,091 | $11,414 |
| 2018 | $498 | $15,621 | $5,091 | $10,530 |
| 2017 | $483 | $15,101 | $5,091 | $10,010 |
| 2016 | $502 | $15,520 | $5,720 | $9,800 |
| 2015 | $462 | $13,560 | $2,400 | $11,160 |
| 2014 | $462 | $14,510 | $2,400 | $12,110 |
Source: Public Records
Map
Nearby Homes
- 23 Oak St NE
- 1 Fir St NE
- 27 Oak St NE
- 42 Dogwood St NE
- 40 Dogwood St NE
- 0 Cypress St NE Unit 7494593
- 0 Cypress St NE Unit 10422946
- 7 Ash St NE
- 0 Euclid Ave Unit 10617853
- 205 Couper St NE
- 311 Reynolds St NE
- 411 Woodward St NE
- 541 Reece St NE
- 219 North Ave NE
- 302 Tolbert St
- 2 Lindberg Dr NE
- 4 N Haven Dr
- 17 Joplin St NE
- 7 Roseway Cir NE
- 17 Elmwood St NE
- 23 Elmwood St NE
- 15 Elmwood St NE
- 20 Hickory St NE
- 22 Hickory St NE
- 18 Hickory St NE
- 24 Elmwood St NE
- 24 Hickory St NE
- 25 Elmwood St NE
- 16 Hickory St NE
- 22 Elmwood St NE
- 26 Elmwood St NE
- 20 Elmwood St NE
- 28 Elmwood St NE
- 26 Hickory St NE
- 27 Elmwood St NE
- 30 Elmwood St NE
- 28 Hickory St NE
- 14 Hickory St NE
- 18 Elmwood St NE