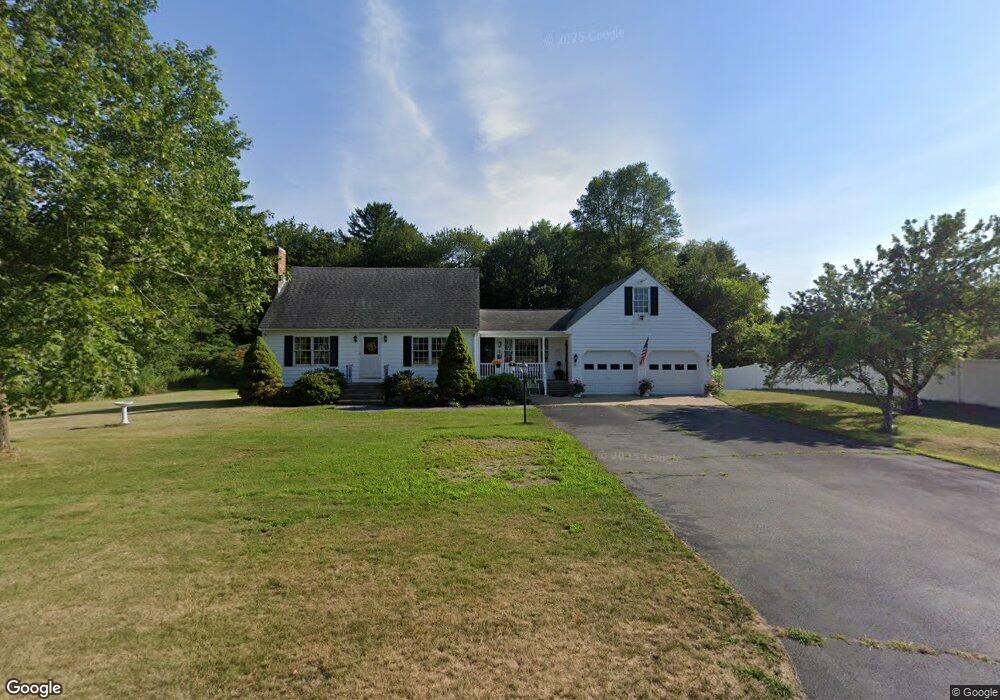
19 Esbjurn Dr Rehoboth, MA 02769
Estimated Value: $613,000 - $660,000
3
Beds
2
Baths
1,956
Sq Ft
$323/Sq Ft
Est. Value
About This Home
This home is located at 19 Esbjurn Dr, Rehoboth, MA 02769 and is currently estimated at $631,447, approximately $322 per square foot. 19 Esbjurn Dr is a home located in Bristol County with nearby schools including Dighton-Rehoboth Regional High School, Grace Baptist Christian Academy, and The Pinecroft School.
Ownership History
Date
Name
Owned For
Owner Type
Purchase Details
Closed on
Jul 22, 2024
Sold by
Storng Linda J
Bought by
Strong Ft
Current Estimated Value
Purchase Details
Closed on
Feb 1, 1968
Bought by
Strong Donald W and Strong Linda J
Create a Home Valuation Report for This Property
The Home Valuation Report is an in-depth analysis detailing your home's value as well as a comparison with similar homes in the area
Home Values in the Area
Average Home Value in this Area
Purchase History
| Date | Buyer | Sale Price | Title Company |
|---|---|---|---|
| Strong Ft | -- | None Available | |
| Strong Ft | -- | None Available | |
| Strong Donald W | -- | -- |
Source: Public Records
Mortgage History
| Date | Status | Borrower | Loan Amount |
|---|---|---|---|
| Previous Owner | Strong Donald W | $25,000 | |
| Previous Owner | Strong Donald W | $105,000 | |
| Previous Owner | Strong Donald W | $75,000 | |
| Previous Owner | Strong Donald W | $50,000 |
Source: Public Records
Tax History Compared to Growth
Tax History
| Year | Tax Paid | Tax Assessment Tax Assessment Total Assessment is a certain percentage of the fair market value that is determined by local assessors to be the total taxable value of land and additions on the property. | Land | Improvement |
|---|---|---|---|---|
| 2025 | $57 | $515,200 | $173,300 | $341,900 |
| 2024 | $4,978 | $438,200 | $173,300 | $264,900 |
| 2023 | $4,985 | $430,500 | $170,000 | $260,500 |
| 2022 | $4,576 | $361,200 | $162,300 | $198,900 |
| 2021 | $1,570 | $345,900 | $147,000 | $198,900 |
| 2020 | $4,452 | $339,300 | $147,000 | $192,300 |
| 2018 | $3,680 | $307,400 | $140,100 | $167,300 |
| 2017 | $3,575 | $284,600 | $140,100 | $144,500 |
| 2016 | $3,375 | $277,800 | $140,100 | $137,700 |
| 2015 | $3,531 | $286,800 | $133,500 | $153,300 |
| 2014 | $3,354 | $269,600 | $127,200 | $142,400 |
Source: Public Records
Map
Nearby Homes
- 84 Fairview Ave
- 0 Sprague Rd Unit Rehoboth Massachuset
- 0 Sprague Rd Unit 73418184
- 132 Fairview Ave
- 1080 Oakhill Ave
- 10 French Farm Rd
- 51 Saveena Dr
- 58 Saveena Dr
- 599 Oakhill Ave
- 15 York Dr
- 96 Mary Rocha Way
- 74 Saveena Dr
- 78 Saveena Dr
- 101 Rocky Hill Rd
- 3 Wilmarth St
- 38 Standish Rd
- 1325 Park St
- Lot 11 Ledge Hill Ln
- Lot 11a Ledge Hill Ln
- 22 Bucklin Dr
- 15 Esbjurn Dr
- 16 Esbjurn Dr
- 11 Esbjurn Dr
- 22 Esbjurn Dr
- 81 Agricultural Ave
- 7 Esbjurn Dr
- 8 Esbjurn Dr
- 87 Agricultural Ave
- 5 Esbjurn Dr
- 77 Agricultural Ave
- 71 Agricultural Ave
- 63 Agricultural Ave
- 67 Agricultural Ave
- 91 Agricultural Ave
- 74 Agricultural Ave
- 417 Tremont St
- 78 Agricultural Ave
- 82 Agricultural Ave
- 421 Tremont St
- 60 Fairfield St