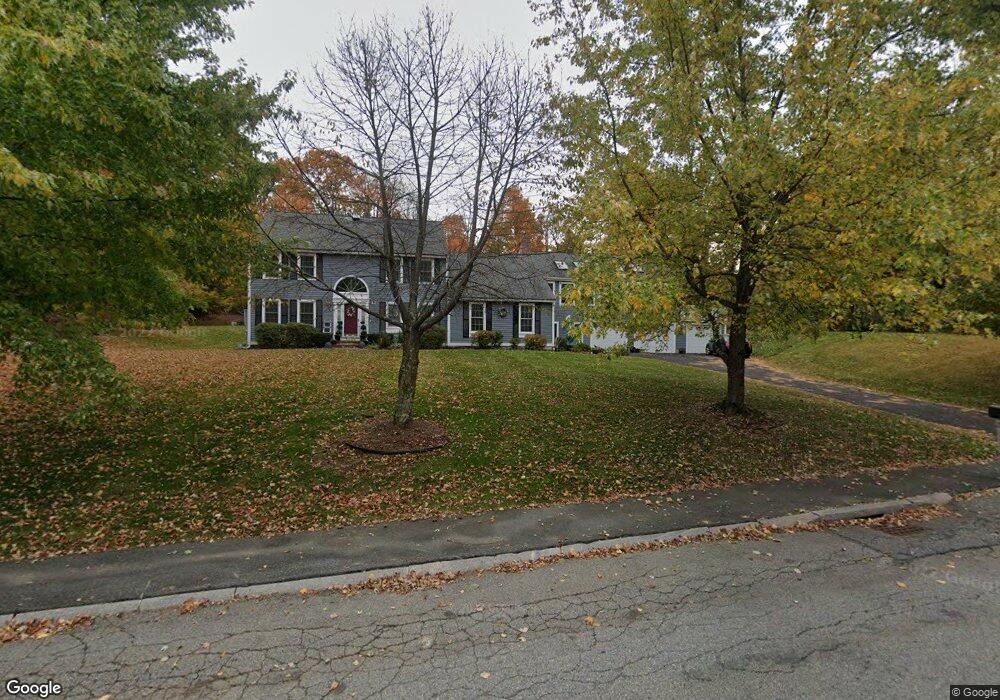
19 Ethier Cir Marlborough, MA 01752
French Hill NeighborhoodEstimated Value: $838,000 - $1,211,000
4
Beds
3
Baths
4,421
Sq Ft
$237/Sq Ft
Est. Value
About This Home
This home is located at 19 Ethier Cir, Marlborough, MA 01752 and is currently estimated at $1,048,247, approximately $237 per square foot. 19 Ethier Cir is a home located in Middlesex County with nearby schools including Marlborough High School, New Covenant Christian School, and Hillside School.
Ownership History
Date
Name
Owned For
Owner Type
Purchase Details
Closed on
Jan 14, 2000
Sold by
Paxton Anthony C and Paxton Lisa R
Bought by
Campbell Matthew C and Campbell Jacqueline
Current Estimated Value
Home Financials for this Owner
Home Financials are based on the most recent Mortgage that was taken out on this home.
Original Mortgage
$200,000
Outstanding Balance
$63,306
Interest Rate
7.79%
Mortgage Type
Purchase Money Mortgage
Estimated Equity
$984,941
Purchase Details
Closed on
May 26, 1999
Sold by
Samaras Xanthe
Bought by
Ewing Albert R and Ewing Kathleen
Home Financials for this Owner
Home Financials are based on the most recent Mortgage that was taken out on this home.
Original Mortgage
$311,250
Interest Rate
6.82%
Mortgage Type
Purchase Money Mortgage
Purchase Details
Closed on
Sep 23, 1994
Sold by
Mcneil Rt and Kilfoyle Ralph
Bought by
Samaras Xanthe
Create a Home Valuation Report for This Property
The Home Valuation Report is an in-depth analysis detailing your home's value as well as a comparison with similar homes in the area
Home Values in the Area
Average Home Value in this Area
Purchase History
| Date | Buyer | Sale Price | Title Company |
|---|---|---|---|
| Campbell Matthew C | $350,000 | -- | |
| Ewing Albert R | $327,650 | -- | |
| Samaras Xanthe | $275,900 | -- |
Source: Public Records
Mortgage History
| Date | Status | Borrower | Loan Amount |
|---|---|---|---|
| Open | Samaras Xanthe | $200,000 | |
| Previous Owner | Samaras Xanthe | $311,250 | |
| Previous Owner | Samaras Xanthe | $247,400 |
Source: Public Records
Tax History Compared to Growth
Tax History
| Year | Tax Paid | Tax Assessment Tax Assessment Total Assessment is a certain percentage of the fair market value that is determined by local assessors to be the total taxable value of land and additions on the property. | Land | Improvement |
|---|---|---|---|---|
| 2025 | $10,760 | $1,091,300 | $226,800 | $864,500 |
| 2024 | $10,300 | $1,005,900 | $206,100 | $799,800 |
| 2023 | $9,882 | $856,300 | $169,000 | $687,300 |
| 2022 | $8,806 | $671,200 | $161,100 | $510,100 |
| 2021 | $9,290 | $644,000 | $131,500 | $512,500 |
| 2020 | $8,773 | $618,700 | $128,200 | $490,500 |
| 2019 | $8,466 | $601,700 | $125,900 | $475,800 |
| 2018 | $8,809 | $558,700 | $116,100 | $442,600 |
| 2017 | $8,567 | $559,200 | $118,000 | $441,200 |
| 2016 | $8,526 | $555,800 | $118,000 | $437,800 |
| 2015 | $8,589 | $545,000 | $121,200 | $423,800 |
Source: Public Records
Map
Nearby Homes