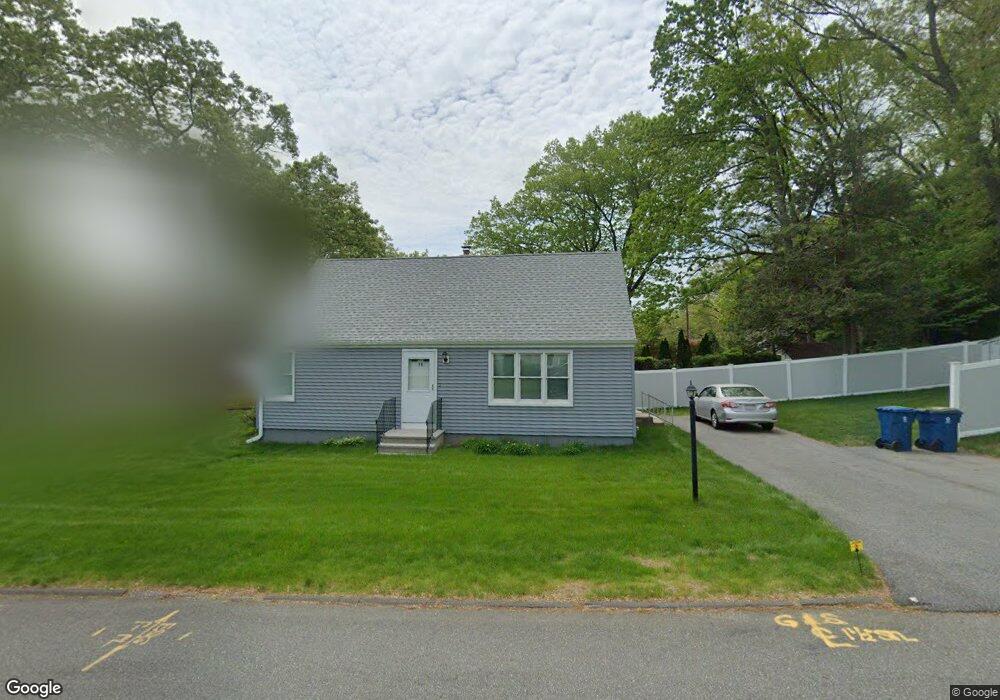
19 Exeter St West Springfield, MA 01089
Estimated Value: $318,000 - $350,000
4
Beds
2
Baths
1,166
Sq Ft
$284/Sq Ft
Est. Value
About This Home
This home is located at 19 Exeter St, West Springfield, MA 01089 and is currently estimated at $331,381, approximately $284 per square foot. 19 Exeter St is a home located in Hampden County with nearby schools including West Springfield High School and St Thomas The Apostle School.
Ownership History
Date
Name
Owned For
Owner Type
Purchase Details
Closed on
Apr 21, 2022
Sold by
Deslauriers Robert T
Bought by
Deslauriers Robert T and Deslauriers Christopher
Current Estimated Value
Purchase Details
Closed on
Dec 23, 2014
Sold by
Deslauriers Robert T
Bought by
Robert T Deslauriers T
Purchase Details
Closed on
Aug 20, 1991
Sold by
Moras Fernand J and Moras Fernand P
Bought by
Deslauriers Carol A and Deslauriers Robert
Create a Home Valuation Report for This Property
The Home Valuation Report is an in-depth analysis detailing your home's value as well as a comparison with similar homes in the area
Home Values in the Area
Average Home Value in this Area
Purchase History
| Date | Buyer | Sale Price | Title Company |
|---|---|---|---|
| Deslauriers Robert T | -- | None Available | |
| Robert T Deslauriers T | -- | -- | |
| Deslauriers Carol A | $90,000 | -- |
Source: Public Records
Mortgage History
| Date | Status | Borrower | Loan Amount |
|---|---|---|---|
| Previous Owner | Deslauriers Carol A | $39,752 | |
| Previous Owner | Deslauriers Carol A | $10,000 | |
| Previous Owner | Deslauriers Carol A | $55,000 | |
| Previous Owner | Deslauriers Carol A | $10,000 |
Source: Public Records
Tax History
| Year | Tax Paid | Tax Assessment Tax Assessment Total Assessment is a certain percentage of the fair market value that is determined by local assessors to be the total taxable value of land and additions on the property. | Land | Improvement |
|---|---|---|---|---|
| 2025 | $3,584 | $241,000 | $107,700 | $133,300 |
| 2024 | $3,584 | $242,000 | $107,700 | $134,300 |
| 2023 | $3,364 | $216,500 | $107,700 | $108,800 |
| 2022 | $2,845 | $180,500 | $97,800 | $82,700 |
| 2021 | $2,821 | $166,900 | $90,400 | $76,500 |
| 2020 | $2,836 | $166,900 | $90,400 | $76,500 |
| 2019 | $2,831 | $166,900 | $90,400 | $76,500 |
| 2018 | $2,846 | $166,900 | $90,400 | $76,500 |
| 2017 | $2,846 | $166,900 | $90,400 | $76,500 |
| 2016 | $2,839 | $167,100 | $86,900 | $80,200 |
| 2015 | $2,783 | $163,800 | $85,100 | $78,700 |
| 2014 | $675 | $163,800 | $85,100 | $78,700 |
Source: Public Records
Map
Nearby Homes
Your Personal Tour Guide
Ask me questions while you tour the home.