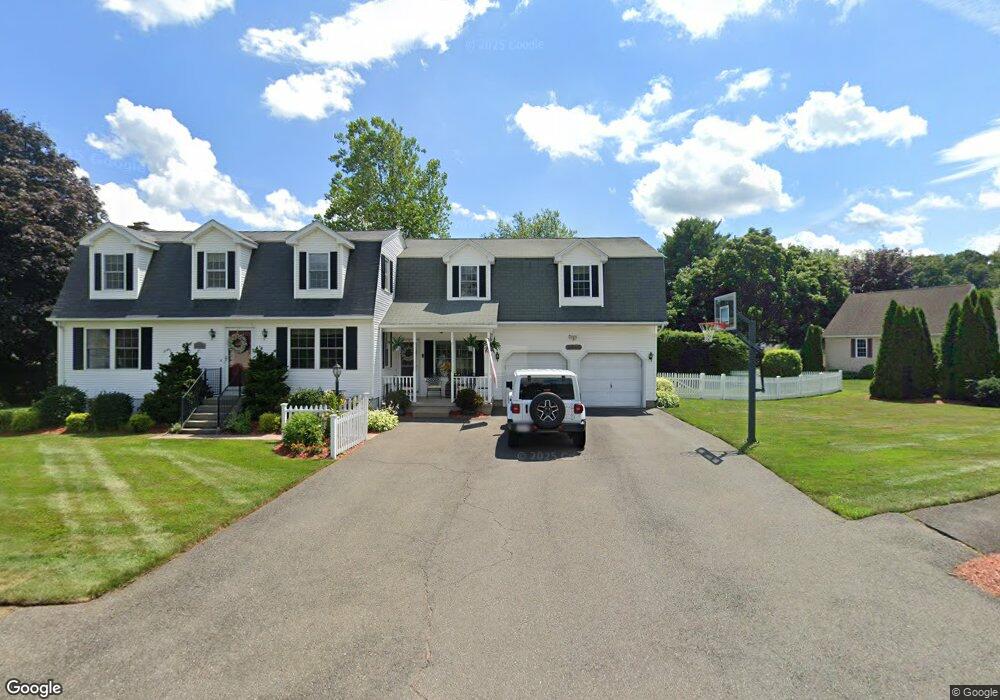
19 Faymore Dr Agawam, MA 01001
Estimated Value: $407,000 - $521,000
4
Beds
4
Baths
2,604
Sq Ft
$184/Sq Ft
Est. Value
About This Home
This home is located at 19 Faymore Dr, Agawam, MA 01001 and is currently estimated at $479,784, approximately $184 per square foot. 19 Faymore Dr is a home located in Hampden County with nearby schools including Agawam Junior High School, Agawam High School, and St Thomas The Apostle School.
Ownership History
Date
Name
Owned For
Owner Type
Purchase Details
Closed on
Jun 14, 1995
Sold by
Pinderman Theodore J and Pinderman Kathleen M
Bought by
Hanchett Richard N and Hanchett Cynthia A
Current Estimated Value
Purchase Details
Closed on
Jun 3, 1991
Sold by
Piazzo Joseph
Bought by
Ruddock Mark F and Ruddock Lisa M
Create a Home Valuation Report for This Property
The Home Valuation Report is an in-depth analysis detailing your home's value as well as a comparison with similar homes in the area
Home Values in the Area
Average Home Value in this Area
Purchase History
| Date | Buyer | Sale Price | Title Company |
|---|---|---|---|
| Hanchett Richard N | $156,250 | -- | |
| Ruddock Mark F | $75,000 | -- |
Source: Public Records
Mortgage History
| Date | Status | Borrower | Loan Amount |
|---|---|---|---|
| Open | Ruddock Mark F | $20,000 | |
| Open | Ruddock Mark F | $119,000 |
Source: Public Records
Tax History Compared to Growth
Tax History
| Year | Tax Paid | Tax Assessment Tax Assessment Total Assessment is a certain percentage of the fair market value that is determined by local assessors to be the total taxable value of land and additions on the property. | Land | Improvement |
|---|---|---|---|---|
| 2025 | $6,141 | $419,500 | $130,500 | $289,000 |
| 2024 | $5,963 | $410,100 | $130,500 | $279,600 |
| 2023 | $5,652 | $358,200 | $117,600 | $240,600 |
| 2022 | $5,452 | $338,400 | $117,600 | $220,800 |
| 2021 | $5,275 | $314,000 | $100,200 | $213,800 |
| 2020 | $5,184 | $308,000 | $98,200 | $209,800 |
| 2019 | $5,013 | $301,100 | $95,400 | $205,700 |
| 2018 | $4,782 | $287,900 | $95,400 | $192,500 |
| 2017 | $4,562 | $279,700 | $95,400 | $184,300 |
| 2016 | $4,351 | $268,900 | $95,400 | $173,500 |
| 2015 | $4,196 | $266,600 | $95,400 | $171,200 |
Source: Public Records
Map
Nearby Homes
- 144 Mallard Cir
- 20 Castle Hill Rd Unit D
- 15 B Castle Hills Rd Unit B
- 111 Cottonwood Ln
- 25 Castle Hill Rd Unit F
- 25 Castle Hill Rd Unit E
- 4 H Castle Hills Rd Unit H
- 1 Castle Hill Rd Unit D
- 31 Cosgrove Ave
- 4H Mapleviewlane Unit 4H
- 48 Cosgrove Ave
- 0 Silver St
- 441 Silver St
- 869-871 Main St
- 73 Silver Lake Dr
- 92 Dogwood Ln
- 33 Dogwood Ln
- 128 Brookfield Ln
- 82 Dogwood Ln
- 52 Peros Dr