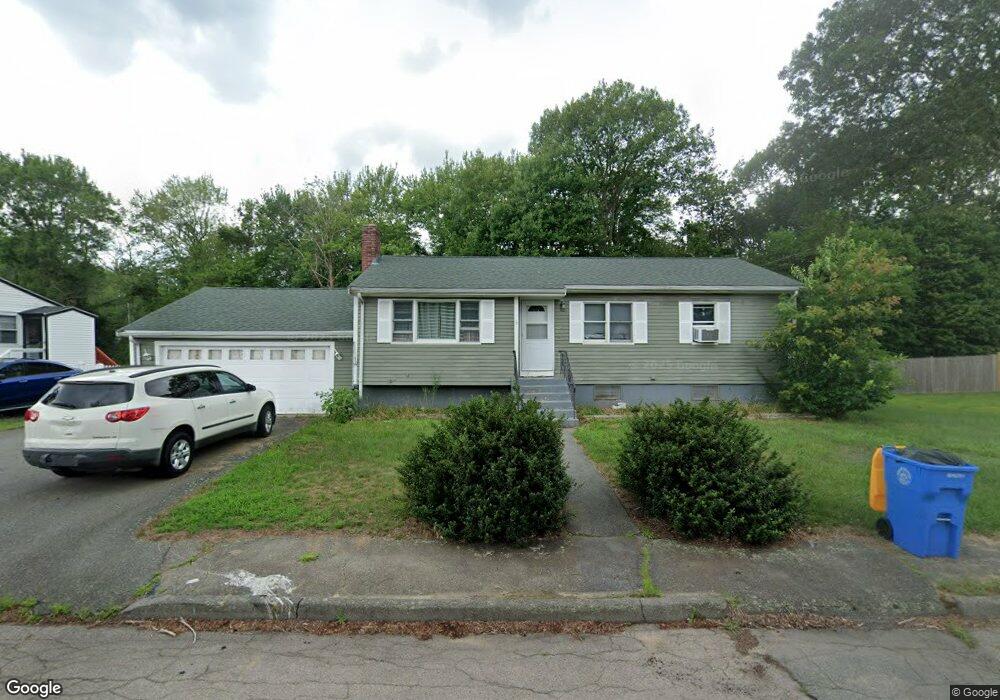
19 Feener Cir Randolph, MA 02368
North Randolph NeighborhoodEstimated Value: $617,000 - $678,000
4
Beds
3
Baths
1,500
Sq Ft
$426/Sq Ft
Est. Value
About This Home
This home is located at 19 Feener Cir, Randolph, MA 02368 and is currently estimated at $638,528, approximately $425 per square foot. 19 Feener Cir is a home located in Norfolk County with nearby schools including Randolph High School and Lighthouse Baptist Christian Academy.
Ownership History
Date
Name
Owned For
Owner Type
Purchase Details
Closed on
Apr 28, 2006
Sold by
Connell Paul L and Connell Karen E
Bought by
Chery Marie J
Current Estimated Value
Home Financials for this Owner
Home Financials are based on the most recent Mortgage that was taken out on this home.
Original Mortgage
$272,500
Outstanding Balance
$157,820
Interest Rate
6.4%
Mortgage Type
Purchase Money Mortgage
Estimated Equity
$480,708
Purchase Details
Closed on
Dec 16, 1996
Sold by
Lapin Daniel and Lapin Linda D
Bought by
Connell Paul L and Connell Karen E
Home Financials for this Owner
Home Financials are based on the most recent Mortgage that was taken out on this home.
Original Mortgage
$146,472
Interest Rate
7.75%
Mortgage Type
Purchase Money Mortgage
Create a Home Valuation Report for This Property
The Home Valuation Report is an in-depth analysis detailing your home's value as well as a comparison with similar homes in the area
Home Values in the Area
Average Home Value in this Area
Purchase History
| Date | Buyer | Sale Price | Title Company |
|---|---|---|---|
| Chery Marie J | $342,000 | -- | |
| Connell Paul L | $144,000 | -- |
Source: Public Records
Mortgage History
| Date | Status | Borrower | Loan Amount |
|---|---|---|---|
| Open | Chery Marie J | $272,500 | |
| Closed | Chery Marie J | $35,100 | |
| Previous Owner | Connell Paul L | $156,200 | |
| Previous Owner | Connell Paul L | $155,000 | |
| Previous Owner | Connell Paul L | $146,472 |
Source: Public Records
Tax History Compared to Growth
Tax History
| Year | Tax Paid | Tax Assessment Tax Assessment Total Assessment is a certain percentage of the fair market value that is determined by local assessors to be the total taxable value of land and additions on the property. | Land | Improvement |
|---|---|---|---|---|
| 2025 | $6,572 | $566,100 | $255,500 | $310,600 |
| 2024 | $6,106 | $533,300 | $250,500 | $282,800 |
| 2023 | $5,912 | $489,400 | $227,700 | $261,700 |
| 2022 | $5,784 | $425,300 | $190,000 | $235,300 |
| 2021 | $5,767 | $390,200 | $158,400 | $231,800 |
| 2020 | $5,600 | $375,600 | $158,400 | $217,200 |
| 2019 | $5,549 | $370,400 | $150,700 | $219,700 |
| 2018 | $5,269 | $331,800 | $137,000 | $194,800 |
| 2017 | $4,915 | $303,800 | $130,300 | $173,500 |
| 2016 | $4,786 | $275,200 | $118,500 | $156,700 |
| 2015 | $4,654 | $257,100 | $113,100 | $144,000 |
Source: Public Records
Map
Nearby Homes
- 68 High St
- 43 Emily Jeffers Rd
- 17 Mazzeo Dr
- 79 Gold St
- 2 Smith Rd
- 159 Bittersweet Ln Unit 107
- 28 Silver St
- 229 Chestnut St
- 59 Highland Glen Dr Unit 328
- 11 Ledgewood Dr
- 16 Simmonds Blvd Unit 16
- 20 Simmonds Blvd Unit 20
- 14 Simmonds Blvd Unit 14
- 12 Simmonds Blvd Unit 12
- 20 Nelson Dr Unit 3A
- 18 Jasper Ln
- 54 Jasper Ln
- 30 Hemlock Terrace
- 12 Jasper Ln Unit 12
- 47 West St Unit A2