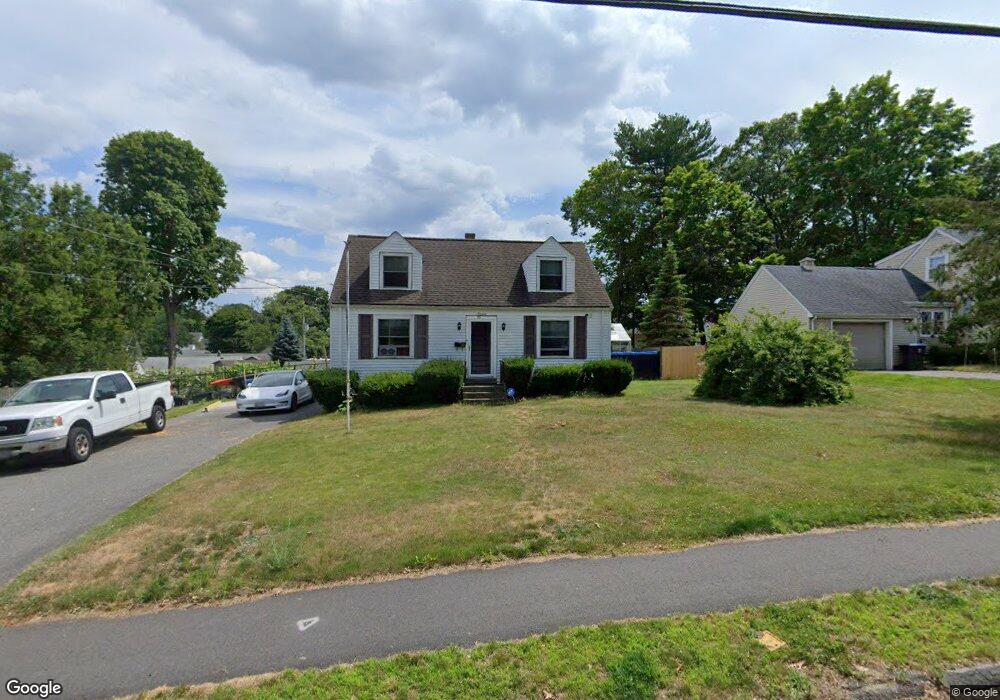
19 Felch Rd Natick, MA 01760
Estimated Value: $619,000 - $822,000
2
Beds
2
Baths
1,075
Sq Ft
$678/Sq Ft
Est. Value
About This Home
This home is located at 19 Felch Rd, Natick, MA 01760 and is currently estimated at $728,834, approximately $677 per square foot. 19 Felch Rd is a home located in Middlesex County with nearby schools including Natick High School, Bennett-Hemenway (Ben-Hem) Elementary School, and Wilson Middle School.
Ownership History
Date
Name
Owned For
Owner Type
Purchase Details
Closed on
Oct 23, 2007
Sold by
Gleason Russell T Est
Bought by
Gleason Gregory R
Current Estimated Value
Purchase Details
Closed on
Jul 25, 1967
Bought by
Gleason Gregory R
Create a Home Valuation Report for This Property
The Home Valuation Report is an in-depth analysis detailing your home's value as well as a comparison with similar homes in the area
Home Values in the Area
Average Home Value in this Area
Purchase History
| Date | Buyer | Sale Price | Title Company |
|---|---|---|---|
| Gleason Gregory R | -- | -- | |
| Gleason Gregory R | -- | -- |
Source: Public Records
Mortgage History
| Date | Status | Borrower | Loan Amount |
|---|---|---|---|
| Previous Owner | Gleason Gregory R | $30,000 | |
| Previous Owner | Gleason Gregory R | $5,000 |
Source: Public Records
Tax History Compared to Growth
Tax History
| Year | Tax Paid | Tax Assessment Tax Assessment Total Assessment is a certain percentage of the fair market value that is determined by local assessors to be the total taxable value of land and additions on the property. | Land | Improvement |
|---|---|---|---|---|
| 2025 | $6,145 | $513,800 | $431,600 | $82,200 |
| 2024 | $5,958 | $486,000 | $406,200 | $79,800 |
| 2023 | $5,910 | $467,600 | $390,400 | $77,200 |
| 2022 | $5,698 | $427,100 | $354,300 | $72,800 |
| 2021 | $5,635 | $414,000 | $334,100 | $79,900 |
| 2020 | $5,618 | $412,800 | $318,900 | $93,900 |
| 2019 | $5,247 | $412,800 | $318,900 | $93,900 |
| 2018 | $10,425 | $381,500 | $303,700 | $77,800 |
| 2017 | $4,616 | $342,200 | $259,700 | $82,500 |
| 2016 | $4,348 | $320,400 | $238,700 | $81,700 |
| 2015 | $4,337 | $313,800 | $238,700 | $75,100 |
Source: Public Records
Map
Nearby Homes