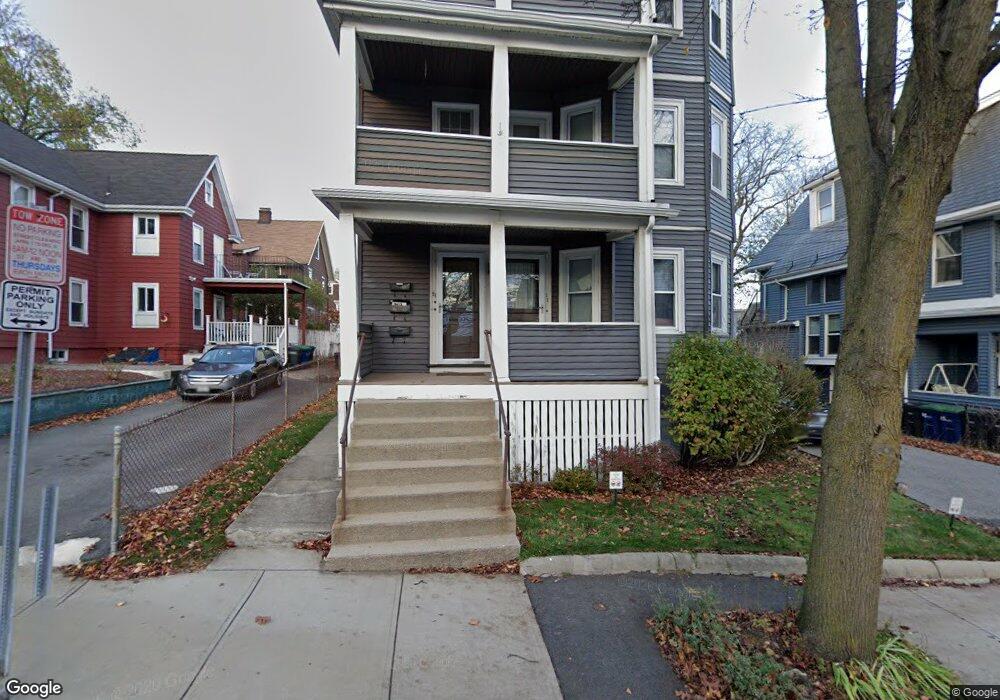
19 Forster St Unit 1 Somerville, MA 02145
Winter Hill NeighborhoodEstimated Value: $579,000 - $1,835,000
2
Beds
1
Bath
873
Sq Ft
$1,066/Sq Ft
Est. Value
About This Home
This home is located at 19 Forster St Unit 1, Somerville, MA 02145 and is currently estimated at $930,902, approximately $1,066 per square foot. 19 Forster St Unit 1 is a home located in Middlesex County with nearby schools including Somerville High School and Bright Future Educare Center.
Ownership History
Date
Name
Owned For
Owner Type
Purchase Details
Closed on
Oct 22, 2010
Sold by
Crafton Luke A and Holland Amy R
Bought by
Benson Christopher R
Current Estimated Value
Home Financials for this Owner
Home Financials are based on the most recent Mortgage that was taken out on this home.
Original Mortgage
$184,000
Outstanding Balance
$121,544
Interest Rate
4.37%
Mortgage Type
Purchase Money Mortgage
Estimated Equity
$809,358
Purchase Details
Closed on
Aug 30, 2004
Sold by
Chen Jane Xiaohong and Wei Yingjie
Bought by
Holland Amy R and Crafton Luke A
Home Financials for this Owner
Home Financials are based on the most recent Mortgage that was taken out on this home.
Original Mortgage
$254,400
Interest Rate
6.02%
Mortgage Type
Purchase Money Mortgage
Purchase Details
Closed on
Apr 1, 2004
Sold by
Fiore-Bassett Annette P and Fiore Anthony N
Bought by
Chen Jane Xiaohong and Wei Yingjie
Home Financials for this Owner
Home Financials are based on the most recent Mortgage that was taken out on this home.
Original Mortgage
$516,000
Interest Rate
5.56%
Mortgage Type
Purchase Money Mortgage
Create a Home Valuation Report for This Property
The Home Valuation Report is an in-depth analysis detailing your home's value as well as a comparison with similar homes in the area
Home Values in the Area
Average Home Value in this Area
Purchase History
| Date | Buyer | Sale Price | Title Company |
|---|---|---|---|
| Benson Christopher R | $319,000 | -- | |
| Holland Amy R | $318,000 | -- | |
| Chen Jane Xiaohong | $692,000 | -- |
Source: Public Records
Mortgage History
| Date | Status | Borrower | Loan Amount |
|---|---|---|---|
| Open | Benson Christopher R | $184,000 | |
| Previous Owner | Holland Amy R | $254,400 | |
| Previous Owner | Chen Jane Xiaohong | $516,000 |
Source: Public Records
Tax History Compared to Growth
Tax History
| Year | Tax Paid | Tax Assessment Tax Assessment Total Assessment is a certain percentage of the fair market value that is determined by local assessors to be the total taxable value of land and additions on the property. | Land | Improvement |
|---|---|---|---|---|
| 2025 | $5,655 | $518,300 | $0 | $518,300 |
| 2024 | $5,309 | $504,700 | $0 | $504,700 |
| 2023 | $5,171 | $500,100 | $0 | $500,100 |
| 2022 | $4,998 | $491,000 | $0 | $491,000 |
| 2021 | $4,901 | $481,000 | $0 | $481,000 |
| 2020 | $4,752 | $471,000 | $0 | $471,000 |
| 2019 | $4,853 | $451,000 | $0 | $451,000 |
| 2018 | $4,939 | $436,700 | $0 | $436,700 |
| 2017 | $4,547 | $389,600 | $0 | $389,600 |
| 2016 | $4,115 | $328,400 | $0 | $328,400 |
| 2015 | $3,910 | $310,100 | $0 | $310,100 |
Source: Public Records
Map
Nearby Homes
- 25 Browning Rd
- 152 Central St
- 115 Thurston St Unit I
- 115 Thurston St Unit B
- 115 Thurston St Unit G
- 456 Medford St Unit 3
- 7 Bond St
- 400 Medford St
- 31 Thurston St Unit 6
- 31 Thurston St Unit 3
- 59 Dartmouth St Unit A
- 466 Medford St Unit 4
- 17 Bond St Unit 1
- 17 Bond St Unit 2
- 37 Main St Unit 1
- 19 Fenwick St Unit 4
- 89 Heath St
- 29 Fenwick St
- 79 Partridge Ave
- 49 Heath St Unit 1
- 21 Forster St Unit 3
- 21 Forster St Unit 2
- 19 Forster St Unit 3,19
- 19 Forster St Unit 1,19
- 19 Forster St Unit 2,19
- 23 Forster St
- 15 Forster St
- 52 Browning Rd
- 56 Browning Rd
- 18 Forster St
- 22 Forster St Unit 2
- 22 Forster St
- 22 Forster St Unit 1
- 11 Forster St
- 167 Central St
- 171 Central St
- 46 Browning Rd
- 52 Tennyson St
- 173 Central St
- 9 Forster St