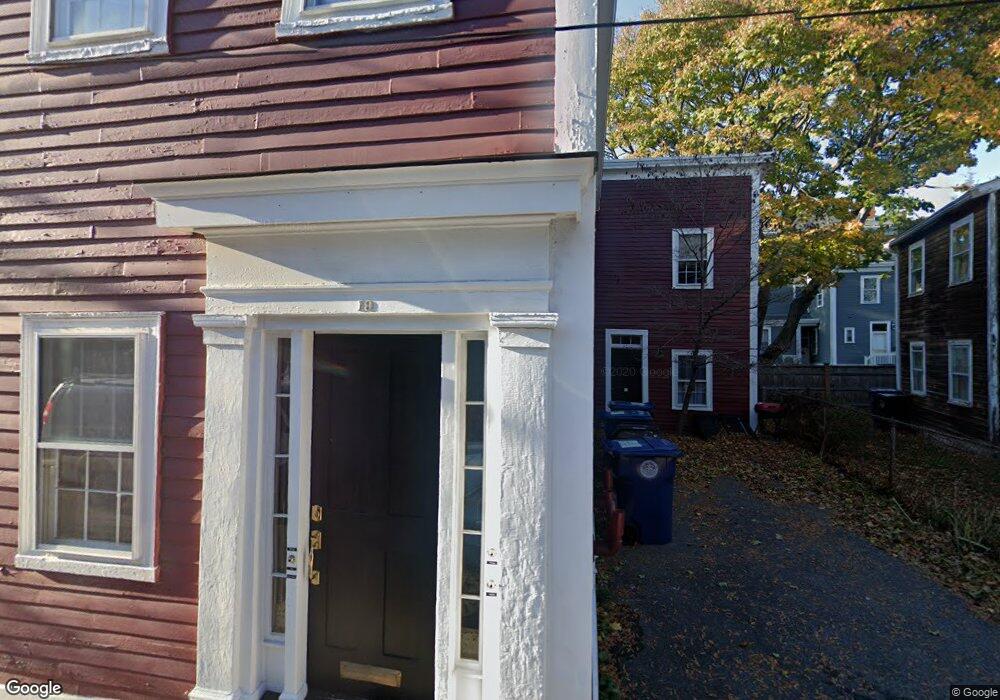
19 Fowler St Salem, MA 01970
Downtown Salem NeighborhoodEstimated Value: $779,000 - $981,000
5
Beds
3
Baths
3,168
Sq Ft
$275/Sq Ft
Est. Value
About This Home
This home is located at 19 Fowler St, Salem, MA 01970 and is currently estimated at $871,664, approximately $275 per square foot. 19 Fowler St is a home located in Essex County with nearby schools including Horace Mann Laboratory, Saltonstall School, and Witchcraft Heights Elementary School.
Ownership History
Date
Name
Owned For
Owner Type
Purchase Details
Closed on
Feb 20, 1990
Sold by
Dupuis Donald
Bought by
Bean Charles L
Current Estimated Value
Home Financials for this Owner
Home Financials are based on the most recent Mortgage that was taken out on this home.
Original Mortgage
$110,000
Interest Rate
9.69%
Mortgage Type
Purchase Money Mortgage
Create a Home Valuation Report for This Property
The Home Valuation Report is an in-depth analysis detailing your home's value as well as a comparison with similar homes in the area
Home Values in the Area
Average Home Value in this Area
Purchase History
| Date | Buyer | Sale Price | Title Company |
|---|---|---|---|
| Bean Charles L | $195,000 | -- |
Source: Public Records
Mortgage History
| Date | Status | Borrower | Loan Amount |
|---|---|---|---|
| Open | Bean Charles L | $25,250 | |
| Closed | Bean Charles L | $30,441 | |
| Closed | Bean Charles L | $91,000 | |
| Closed | Bean Charles L | $110,000 |
Source: Public Records
Tax History Compared to Growth
Tax History
| Year | Tax Paid | Tax Assessment Tax Assessment Total Assessment is a certain percentage of the fair market value that is determined by local assessors to be the total taxable value of land and additions on the property. | Land | Improvement |
|---|---|---|---|---|
| 2025 | $8,626 | $760,700 | $193,700 | $567,000 |
| 2024 | $7,972 | $686,100 | $184,100 | $502,000 |
| 2023 | $7,725 | $617,500 | $169,900 | $447,600 |
| 2022 | $7,715 | $582,300 | $164,200 | $418,100 |
| 2021 | $7,398 | $536,100 | $152,900 | $383,200 |
| 2020 | $7,021 | $485,900 | $144,400 | $341,500 |
| 2019 | $6,923 | $458,500 | $137,100 | $321,400 |
| 2018 | $6,410 | $416,800 | $130,300 | $286,500 |
| 2017 | $6,009 | $378,900 | $109,900 | $269,000 |
| 2016 | $5,857 | $373,800 | $104,800 | $269,000 |
| 2015 | $5,711 | $348,000 | $96,300 | $251,700 |
Source: Public Records
Map
Nearby Homes
- 35 Flint St Unit 209
- 35 Flint St Unit 106
- 145 Federal St Unit 3
- 38 Chestnut St
- 97 Mason St Unit 2
- 23 Proctor St
- 2 Hillside Ave
- 17 North St Unit 2
- 57 Endicott St Unit 2
- 11 Summer St
- 304 Essex St Unit 1
- 78 Federal St
- 128 Boston St Unit 4
- 3 S Mason St
- 15 Lynde St Unit 26
- 25 Calabrese St
- 47 Federal St
- 145 Boston St
- 55 Butler St
- 140 Washington St Unit 1C
- 21 Fowler St
- 2 Griffin Place
- 2 Griffin Place Unit 3
- 2 Griffin Place Unit 2
- 22 Fowler St
- 20 Fowler St
- 20 Fowler St Unit 1
- 20 Fowler St Unit A
- 20 Fowler St Unit 20
- 8 N Pine St
- 15 Fowler St
- 24 Fowler St
- 24 Fowler St Unit 2
- 24 Fowler St Unit 1
- 169 Federal St
- 6 N Pine St
- 13 N Pine St Unit 8
- 13 N Pine St Unit 7
- 11 N Pine St Unit 6
- 11 N Pine St Unit 5