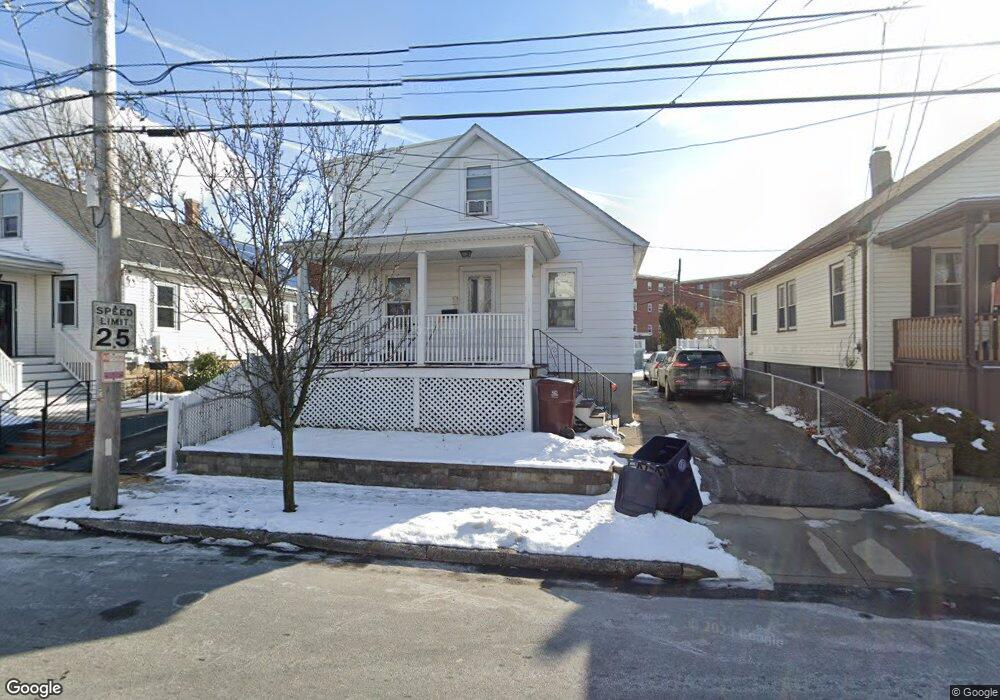
19 Fuller St Everett, MA 02149
Glendale NeighborhoodEstimated Value: $535,000 - $602,000
About This Home
This home is located at 19 Fuller St, Everett, MA 02149 and is currently estimated at $563,038, approximately $643 per square foot. 19 Fuller St is a home located in Middlesex County with nearby schools including Everett High School, Pioneer Charter School of Science, and Malden Catholic.
Ownership History
We collect this data history from publicly available records. To have your information removed, we recommend requesting removal directly through your county’s website.
Purchase Details
Home Financials for this Owner
Home Financials are based on the most recent Mortgage that was taken out on this home.Home Values in the Area
Average Home Value in this Area
Purchase History
We collect this data history from publicly available records. To have your information removed, we recommend requesting removal directly through your county’s website.
| Date | Buyer | Sale Price | Title Company |
|---|---|---|---|
| $108,000 | -- |
Mortgage History
We collect this data history from publicly available records. To have your information removed, we recommend requesting removal directly through your county’s website.
| Date | Status | Borrower | Loan Amount |
|---|---|---|---|
| Open | $66,000 |
Tax History
We collect this data history from publicly available records. To have your information removed, we recommend requesting removal directly through your county’s website.
| Year | Tax Paid | Tax Assessment Tax Assessment Total Assessment is a certain percentage of the fair market value that is determined by local assessors to be the total taxable value of land and additions on the property. | Land | Improvement |
|---|---|---|---|---|
| 2025 | $4,932 | $433,000 | $223,700 | $209,300 |
| 2024 | $4,956 | $432,500 | $223,700 | $208,800 |
| 2023 | $4,849 | $411,600 | $213,900 | $197,700 |
| 2022 | $4,083 | $394,100 | $204,200 | $189,900 |
| 2021 | $3,612 | $366,000 | $182,800 | $183,200 |
| 2020 | $3,836 | $360,500 | $182,800 | $177,700 |
| 2019 | $4,051 | $327,200 | $174,100 | $153,100 |
| 2018 | $4,174 | $302,900 | $163,400 | $139,500 |
| 2017 | $3,762 | $260,500 | $136,100 | $124,400 |
| 2016 | $3,495 | $241,900 | $121,600 | $120,300 |
| 2015 | $3,284 | $224,800 | $109,600 | $115,200 |
Map
- 14 Oak Terrace
- 17 Estes St
- 39 Broadway Unit 305
- 73 Taylor St
- 40 Glendale Ave
- 859 Broadway Unit 15
- 826 Broadway
- 24-26 Edith Ave
- 51 Adams Ave
- 42 Freeman Ave
- 15 Marie Ave
- 38 Adams Ave
- 159 Jefferson Ave
- 444 Bryant St
- 233 Washington Ave
- 140 Lyme St
- 87 Madison Ave Unit 3
- 566 Proctor Ave
- 592 Mountain Ave
- 8 Parker St Unit 5
Ask me questions while you tour the home.