
19 Fulton St Hanover, PA 17331
Hanover Historic District NeighborhoodEstimated payment $1,324/month
Highlights
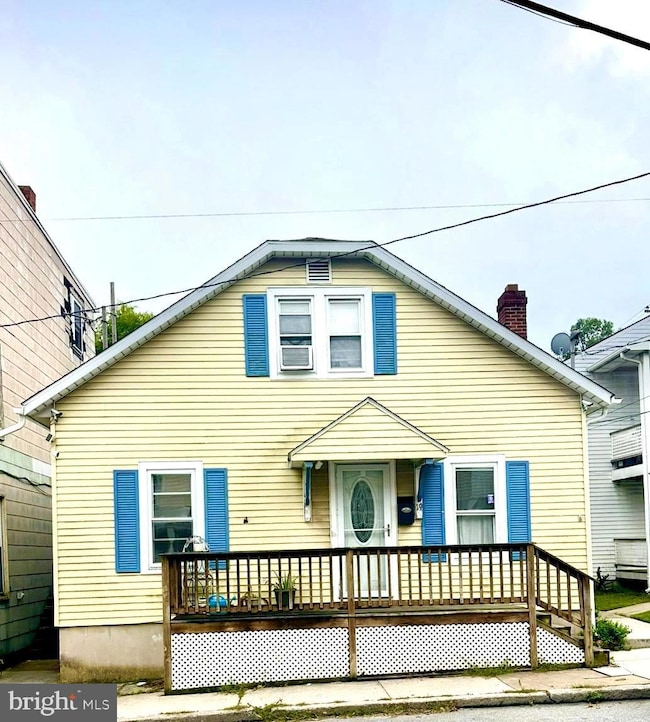
- Cape Cod Architecture
- No HOA
- Forced Air Heating and Cooling System
- Hanover Street Elementary School Rated A-
About This Home
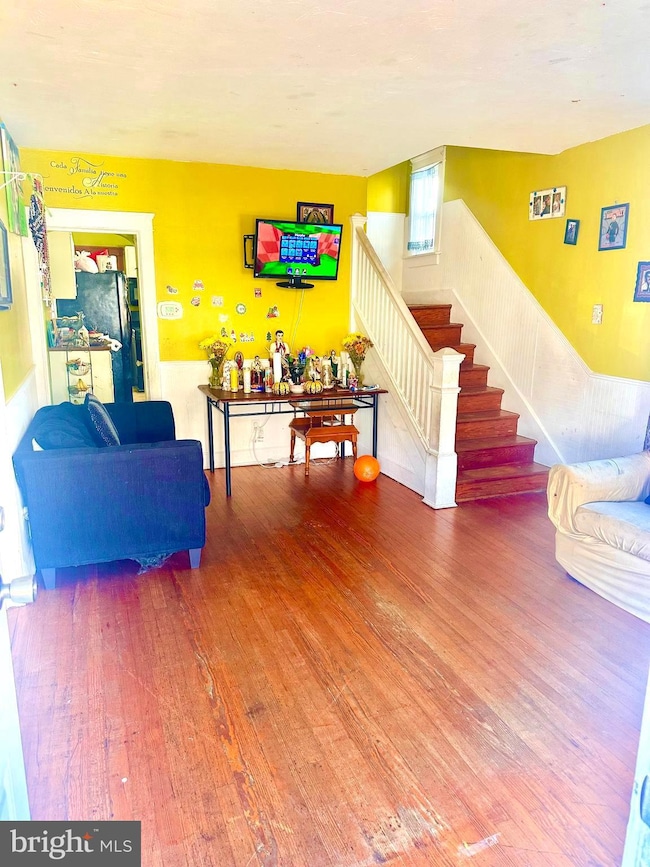
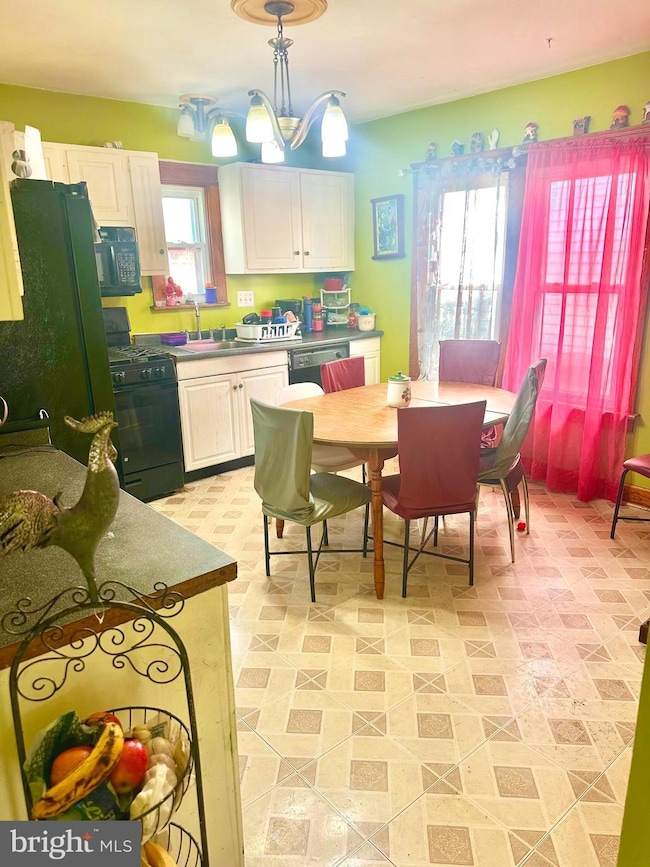
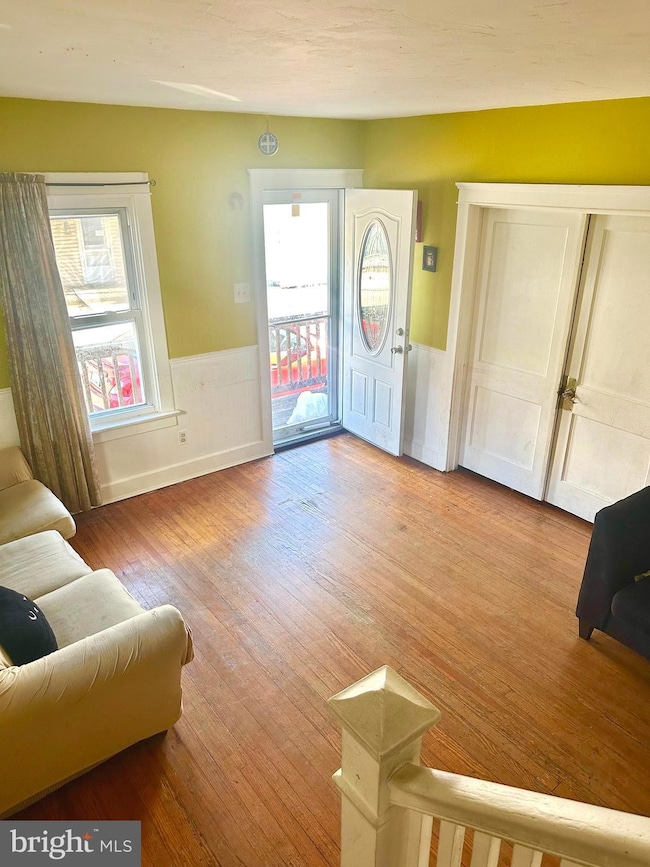
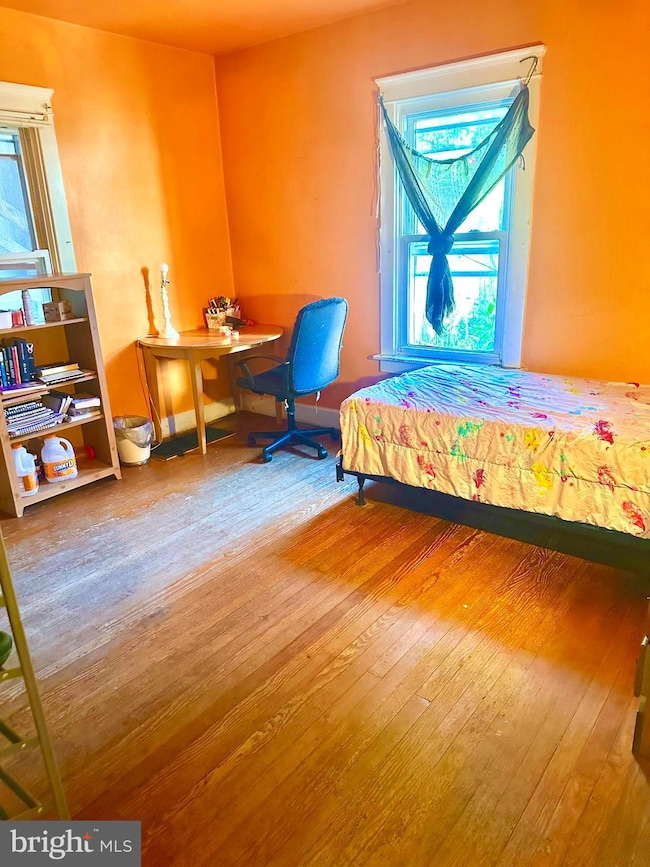
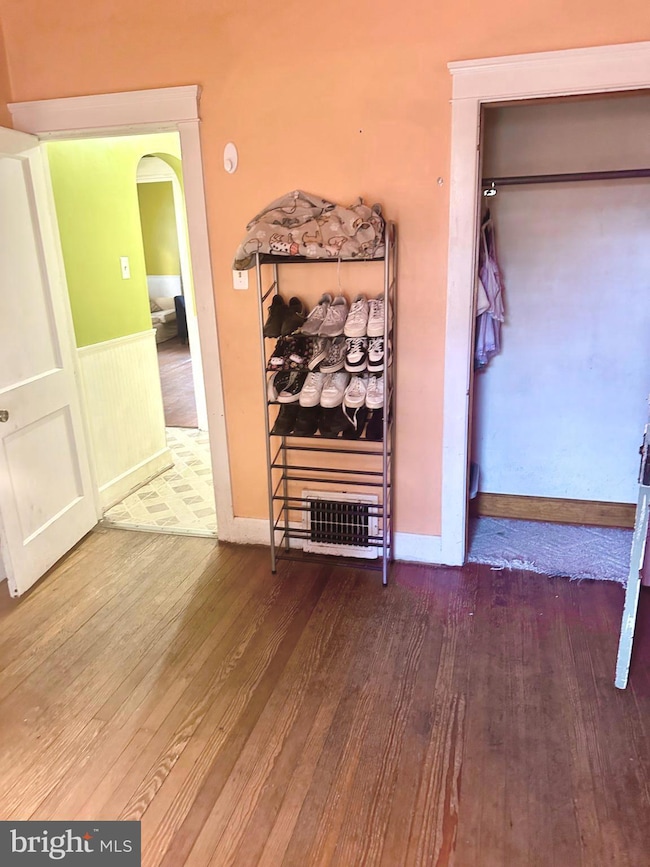
REDUCED QUICKLY....Because, Seller received ratified contract on purchase of their next home! Centrail Air Conditioning, New Roof, TWO first floor bedrooms, One first floor Full Bathroom, 2 MORE rooms on 2nd floor and a half bathroom as well on 2nd floor.........Comfy, Cozy & Full of Charm! Welcome home to this sweet 4 bedroom, 2 bath gem right in the heart of Hanover! With two bedrooms and a bath on each floor, there's room and flexibility for everyone. You'll love the bright, cheerful kitchen that just feels like "home" and the fenced backyard- perfect for kids, pets, or a little garden oasis. The unfinished basement offers plenty of storage and laundry space. Conveniently located close to all your favorite shops, restaurants, and local spots, this home is ready for a new family to fill it with love and laughter. Come see why this cozy Hanover cutie won't last long! CALL TODAY!
Listing Agent
(717) 476-1671 staceyrwhite218@gmail.com Coldwell Banker Realty License #500981 Listed on: 10/24/2025

Home Details
Home Type
- Single Family
Est. Annual Taxes
- $3,585
Year Built
- Built in 1944
Parking
- On-Street Parking
Home Design
- Cape Cod Architecture
- Aluminum Siding
- Vinyl Siding
- Concrete Perimeter Foundation
Interior Spaces
- 1,502 Sq Ft Home
- Property has 1.5 Levels
- Basement Fills Entire Space Under The House
Bedrooms and Bathrooms
Additional Features
- 1,799 Sq Ft Lot
- Forced Air Heating and Cooling System
Community Details
- No Home Owners Association
- Hanover Boro Subdivision
Listing and Financial Details
- Tax Lot 0581
- Assessor Parcel Number 67-000-04-0581-00-00000
Map
Home Values in the Area
Average Home Value in this Area
Tax History
| Year | Tax Paid | Tax Assessment Tax Assessment Total Assessment is a certain percentage of the fair market value that is determined by local assessors to be the total taxable value of land and additions on the property. | Land | Improvement |
|---|---|---|---|---|
| 2025 | $3,586 | $97,940 | $19,440 | $78,500 |
| 2024 | $3,558 | $97,940 | $19,440 | $78,500 |
| 2023 | $3,531 | $97,940 | $19,440 | $78,500 |
| 2022 | $3,488 | $97,940 | $19,440 | $78,500 |
| 2021 | $3,390 | $97,940 | $19,440 | $78,500 |
| 2020 | $3,390 | $97,940 | $19,440 | $78,500 |
| 2019 | $3,337 | $97,940 | $19,440 | $78,500 |
| 2018 | $3,275 | $97,940 | $19,440 | $78,500 |
| 2017 | $3,213 | $97,940 | $19,440 | $78,500 |
| 2016 | $0 | $97,940 | $19,440 | $78,500 |
| 2015 | -- | $97,940 | $19,440 | $78,500 |
| 2014 | -- | $97,940 | $19,440 | $78,500 |
Property History
| Date | Event | Price | List to Sale | Price per Sq Ft |
|---|---|---|---|---|
| 11/04/2025 11/04/25 | Pending | -- | -- | -- |
| 10/25/2025 10/25/25 | Price Changed | $194,900 | -4.9% | $130 / Sq Ft |
| 10/24/2025 10/24/25 | For Sale | $204,900 | -- | $136 / Sq Ft |
Purchase History
| Date | Type | Sale Price | Title Company |
|---|---|---|---|
| Deed | -- | None Listed On Document | |
| Deed | $114,900 | -- | |
| Deed | $89,900 | Resource Title Llc |
Mortgage History
| Date | Status | Loan Amount | Loan Type |
|---|---|---|---|
| Previous Owner | $114,900 | Fannie Mae Freddie Mac | |
| Previous Owner | $70,000 | Purchase Money Mortgage |
Source: Bright MLS
MLS Number: PAYK2092268
APN: 67-000-04-0581.00-00000
Disclaimer: Certain information contained herein is derived from information provided by parties other than Homes.com. All information provided is deemed reliable, but is not guaranteed to be accurate and should be independently verified.
![]() The data relating to real estate for sale on this website appears in part through the BRIGHT Internet Data Exchange program, a voluntary cooperative exchange of property listing data between licensed real estate brokerage firms, and is provided by BRIGHT through a licensing agreement.
The data relating to real estate for sale on this website appears in part through the BRIGHT Internet Data Exchange program, a voluntary cooperative exchange of property listing data between licensed real estate brokerage firms, and is provided by BRIGHT through a licensing agreement.
Listing information is from various brokers who participate in the Bright MLS IDX program and not all listings may be visible on the site.
The property information being provided on or through the website is for the personal, non-commercial use of consumers and such information may not be used for any purpose other than to identify prospective properties consumers may be interested in purchasing.
Some properties which appear for sale on the website may no longer be available because they are for instance, under contract, sold or are no longer being offered for sale.
Property information displayed is deemed reliable but is not guaranteed.
Copyright 2025 Bright MLS, Inc.