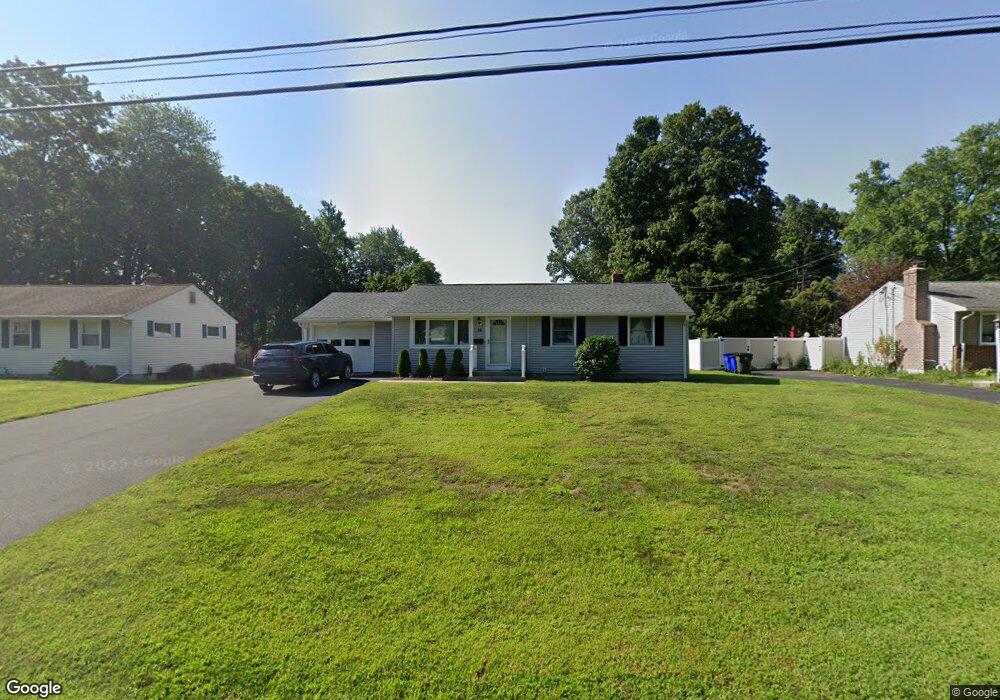
19 Garry Rd Windsor Locks, CT 06096
Estimated Value: $280,000 - $319,000
3
Beds
2
Baths
960
Sq Ft
$312/Sq Ft
Est. Value
About This Home
This home is located at 19 Garry Rd, Windsor Locks, CT 06096 and is currently estimated at $299,692, approximately $312 per square foot. 19 Garry Rd is a home located in Hartford County with nearby schools including North Street School, South Elementary School, and Windsor Locks Middle School.
Ownership History
Date
Name
Owned For
Owner Type
Purchase Details
Closed on
Mar 26, 2010
Sold by
Bean Mark
Bought by
Pepin Deborah
Current Estimated Value
Home Financials for this Owner
Home Financials are based on the most recent Mortgage that was taken out on this home.
Original Mortgage
$115,000
Outstanding Balance
$76,372
Interest Rate
5.02%
Estimated Equity
$223,320
Purchase Details
Closed on
Aug 28, 1998
Sold by
Fahey Minnie
Bought by
Bean Mark
Home Financials for this Owner
Home Financials are based on the most recent Mortgage that was taken out on this home.
Original Mortgage
$102,125
Interest Rate
6.9%
Mortgage Type
Unknown
Purchase Details
Closed on
Jun 26, 1995
Sold by
Navin Joseph and Navin Suzanne
Bought by
Cope Annette
Create a Home Valuation Report for This Property
The Home Valuation Report is an in-depth analysis detailing your home's value as well as a comparison with similar homes in the area
Home Values in the Area
Average Home Value in this Area
Purchase History
| Date | Buyer | Sale Price | Title Company |
|---|---|---|---|
| Pepin Deborah | $170,000 | -- | |
| Bean Mark | $107,500 | -- | |
| Cope Annette | $184,500 | -- |
Source: Public Records
Mortgage History
| Date | Status | Borrower | Loan Amount |
|---|---|---|---|
| Open | Cope Annette | $115,000 | |
| Previous Owner | Cope Annette | $87,910 | |
| Previous Owner | Cope Annette | $102,125 | |
| Previous Owner | Cope Annette | $30,000 |
Source: Public Records
Tax History
| Year | Tax Paid | Tax Assessment Tax Assessment Total Assessment is a certain percentage of the fair market value that is determined by local assessors to be the total taxable value of land and additions on the property. | Land | Improvement |
|---|---|---|---|---|
| 2025 | $4,855 | $202,370 | $58,030 | $144,340 |
| 2024 | $3,347 | $118,930 | $45,640 | $73,290 |
| 2023 | $3,131 | $118,930 | $45,640 | $73,290 |
| 2022 | $3,072 | $118,930 | $45,640 | $73,290 |
| 2021 | $3,072 | $118,930 | $45,640 | $73,290 |
| 2020 | $3,072 | $118,930 | $45,640 | $73,290 |
| 2019 | $2,992 | $115,850 | $45,640 | $70,210 |
| 2017 | $2,805 | $105,200 | $45,100 | $60,100 |
| 2016 | $2,805 | $105,200 | $45,100 | $60,100 |
| 2015 | $2,818 | $105,200 | $45,100 | $60,100 |
| 2014 | $3,184 | $121,400 | $51,200 | $70,200 |
Source: Public Records
Map
Nearby Homes
- 24 Bel-Aire Cir
- 124 Bel-Aire Cir
- 94 Raymond Rd
- 241 S Water St Unit 11
- 241 S Water St Unit 14
- 59 Elm St
- 140 S Water St
- 10 Helena Ln
- 13 Riverview Dr Unit F
- 32 Walnut Cir
- 216 Adams Hill Way Unit 216
- 248 Adams Hill Way Unit 248
- 216 Hayden Station Rd
- 202 Reed Ave
- 4 Woodland Hollow St
- 64 Main St
- 404 Woodland St
- 443 Elm St
- 30 Jackson St
- 0 N Water St Unit 24138494
Your Personal Tour Guide
Ask me questions while you tour the home.