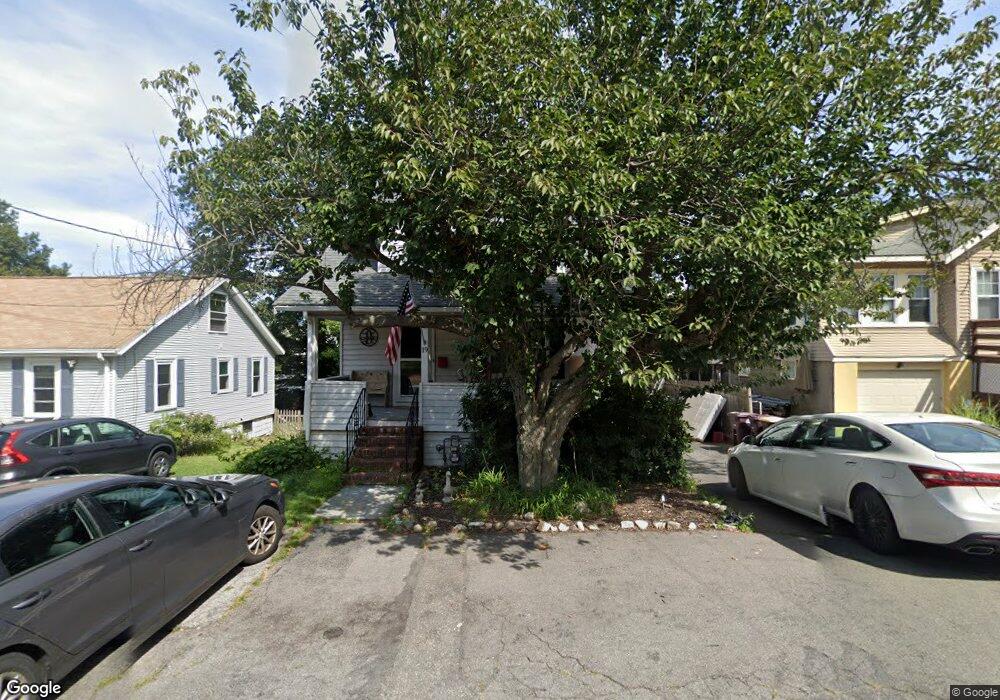
19 Gibbens St Weymouth, MA 02188
Weymouth Landing NeighborhoodEstimated Value: $514,078 - $591,000
3
Beds
2
Baths
1,189
Sq Ft
$459/Sq Ft
Est. Value
About This Home
This home is located at 19 Gibbens St, Weymouth, MA 02188 and is currently estimated at $545,270, approximately $458 per square foot. 19 Gibbens St is a home located in Norfolk County with nearby schools including Frederick C Murphy, Abigail Adams Middle School, and Weymouth Middle School Chapman.
Ownership History
Date
Name
Owned For
Owner Type
Purchase Details
Closed on
Jul 7, 2000
Sold by
Clapp Ronald D and Clapp Patricia A
Bought by
Dolan Dennis P and Dolan Marianne
Current Estimated Value
Home Financials for this Owner
Home Financials are based on the most recent Mortgage that was taken out on this home.
Original Mortgage
$185,250
Interest Rate
8.55%
Mortgage Type
Purchase Money Mortgage
Create a Home Valuation Report for This Property
The Home Valuation Report is an in-depth analysis detailing your home's value as well as a comparison with similar homes in the area
Home Values in the Area
Average Home Value in this Area
Purchase History
| Date | Buyer | Sale Price | Title Company |
|---|---|---|---|
| Dolan Dennis P | $195,000 | -- |
Source: Public Records
Mortgage History
| Date | Status | Borrower | Loan Amount |
|---|---|---|---|
| Open | Dolan Dennis P | $188,000 | |
| Closed | Dolan Dennis P | $185,250 | |
| Previous Owner | Dolan Dennis P | $91,000 |
Source: Public Records
Tax History
| Year | Tax Paid | Tax Assessment Tax Assessment Total Assessment is a certain percentage of the fair market value that is determined by local assessors to be the total taxable value of land and additions on the property. | Land | Improvement |
|---|---|---|---|---|
| 2025 | $4,699 | $465,200 | $208,000 | $257,200 |
| 2024 | $4,552 | $443,200 | $198,100 | $245,100 |
| 2023 | $4,390 | $420,100 | $183,500 | $236,600 |
| 2022 | $4,293 | $374,600 | $169,900 | $204,700 |
| 2021 | $3,904 | $332,500 | $169,900 | $162,600 |
| 2020 | $3,701 | $310,500 | $169,900 | $140,600 |
| 2019 | $3,614 | $298,200 | $163,400 | $134,800 |
| 2018 | $3,511 | $280,900 | $155,600 | $125,300 |
| 2017 | $3,361 | $262,400 | $148,200 | $114,200 |
| 2016 | $3,231 | $252,400 | $142,500 | $109,900 |
| 2015 | $3,051 | $236,500 | $136,000 | $100,500 |
| 2014 | $2,927 | $220,100 | $126,600 | $93,500 |
Source: Public Records
Map
Nearby Homes
- 25 Richmond St
- 46 Roosevelt Rd
- 116 Gordon Rd
- 122 Washington St Unit Twenty-two
- 11 Richmond St
- 114 Broad St Unit D
- 16 Beechwood Rd
- 19 Vine St Unit 3
- 19 Vine St Unit 2
- 16 Lindbergh Ave
- 37 Lantern Ln
- 125 Allen St Unit A
- 41 Lantern Ln
- 70 Biscayne Ave
- 15 Summer St
- 51 Faxon St
- 33 Congress St
- 145 Jaffrey St
- 107 Summer St
- 97 Liberty St