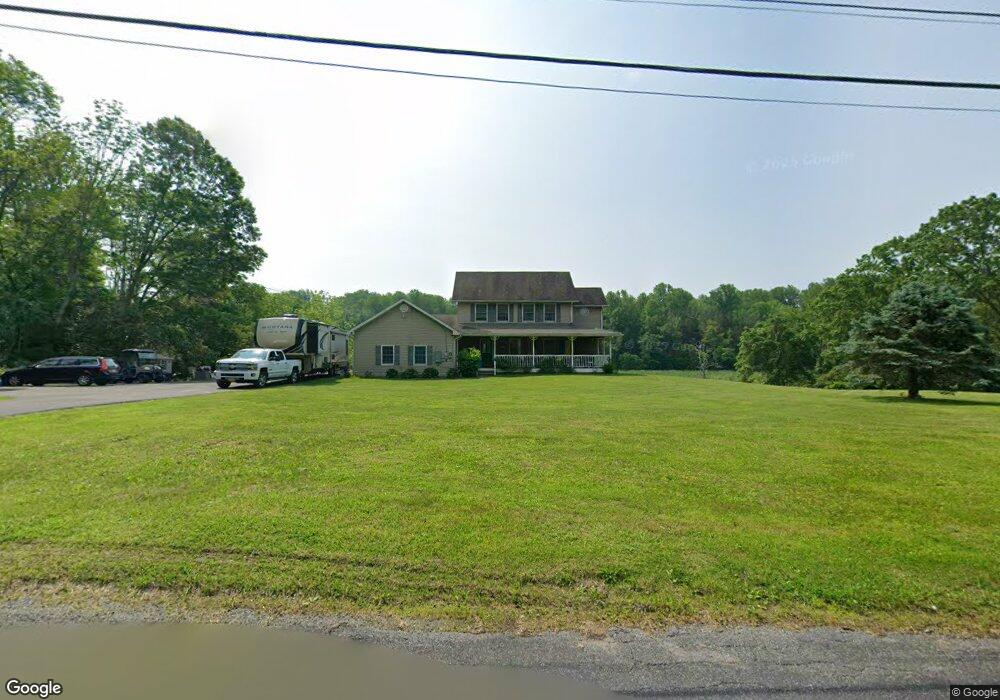
19 Golden Chain Rd Blairstown, NJ 07825
Estimated Value: $636,773 - $677,000
--
Bed
--
Bath
2,516
Sq Ft
$260/Sq Ft
Est. Value
About This Home
This home is located at 19 Golden Chain Rd, Blairstown, NJ 07825 and is currently estimated at $653,443, approximately $259 per square foot. 19 Golden Chain Rd is a home located in Warren County with nearby schools including Frelinghuysen Township Elementary School, North Warren Regional School, and Ridge & Valley Charter School.
Ownership History
Date
Name
Owned For
Owner Type
Purchase Details
Closed on
Jul 10, 2002
Sold by
Fletcher Lucian
Bought by
Fletcher Lucian and Murphy Melissa E
Current Estimated Value
Home Financials for this Owner
Home Financials are based on the most recent Mortgage that was taken out on this home.
Original Mortgage
$170,000
Outstanding Balance
$72,475
Interest Rate
6.79%
Estimated Equity
$580,968
Purchase Details
Closed on
Jan 16, 1997
Sold by
Bentley Allan
Bought by
Torres Xael and Torres Linda S
Home Financials for this Owner
Home Financials are based on the most recent Mortgage that was taken out on this home.
Original Mortgage
$186,000
Interest Rate
7.36%
Purchase Details
Closed on
Dec 12, 1994
Sold by
Park Ebenezer
Bought by
Bentley Allan
Create a Home Valuation Report for This Property
The Home Valuation Report is an in-depth analysis detailing your home's value as well as a comparison with similar homes in the area
Home Values in the Area
Average Home Value in this Area
Purchase History
| Date | Buyer | Sale Price | Title Company |
|---|---|---|---|
| Fletcher Lucian | -- | Chicago Title Insurance Co | |
| Fletcher Lucian | $365,000 | -- | |
| Torres Xael | $232,500 | First American Title Ins Co | |
| Bentley Allan | $33,500 | -- |
Source: Public Records
Mortgage History
| Date | Status | Borrower | Loan Amount |
|---|---|---|---|
| Open | Fletcher Lucian | $170,000 | |
| Previous Owner | Torres Xael | $186,000 |
Source: Public Records
Tax History Compared to Growth
Tax History
| Year | Tax Paid | Tax Assessment Tax Assessment Total Assessment is a certain percentage of the fair market value that is determined by local assessors to be the total taxable value of land and additions on the property. | Land | Improvement |
|---|---|---|---|---|
| 2025 | $12,321 | $431,100 | $91,900 | $339,200 |
| 2024 | $11,648 | $431,100 | $91,900 | $339,200 |
| 2023 | $10,558 | $431,100 | $91,900 | $339,200 |
| 2022 | $10,558 | $431,100 | $91,900 | $339,200 |
| 2021 | $10,786 | $431,100 | $91,900 | $339,200 |
| 2020 | $10,786 | $431,100 | $91,900 | $339,200 |
| 2019 | $10,536 | $431,100 | $91,900 | $339,200 |
| 2018 | $10,536 | $422,000 | $91,900 | $330,100 |
| 2017 | $10,191 | $422,000 | $91,900 | $330,100 |
| 2016 | $9,947 | $422,000 | $91,900 | $330,100 |
| 2015 | $10,301 | $422,000 | $91,900 | $330,100 |
| 2014 | $10,077 | $422,000 | $91,900 | $330,100 |
Source: Public Records
Map
Nearby Homes
- 144 Camp Wasigan Rd
- 260 Silver Lake Rd
- 126 Camp Wasigan Rd
- 264 Silver Lake Rd
- 253 Silver Lake Rd
- 247 Silver Lake Rd
- 255 Silver Lake Rd
- 25 Golden Chain Rd
- 259 Silver Lake Rd
- 30 Golden Chain Rd
- 31 Golden Chain Rd
- 272 Silver Lake Rd
- 110 Camp Wasigan Rd
- 267 Silver Lake Rd
- 106 Camp Wasigan Rd
- 39 Golden Chain Rd
- 10 Ackerson Rd
- 228 Silver Lake Rd
- 230 Silver Lake Rd
- 112 Camp Wasigan Rd