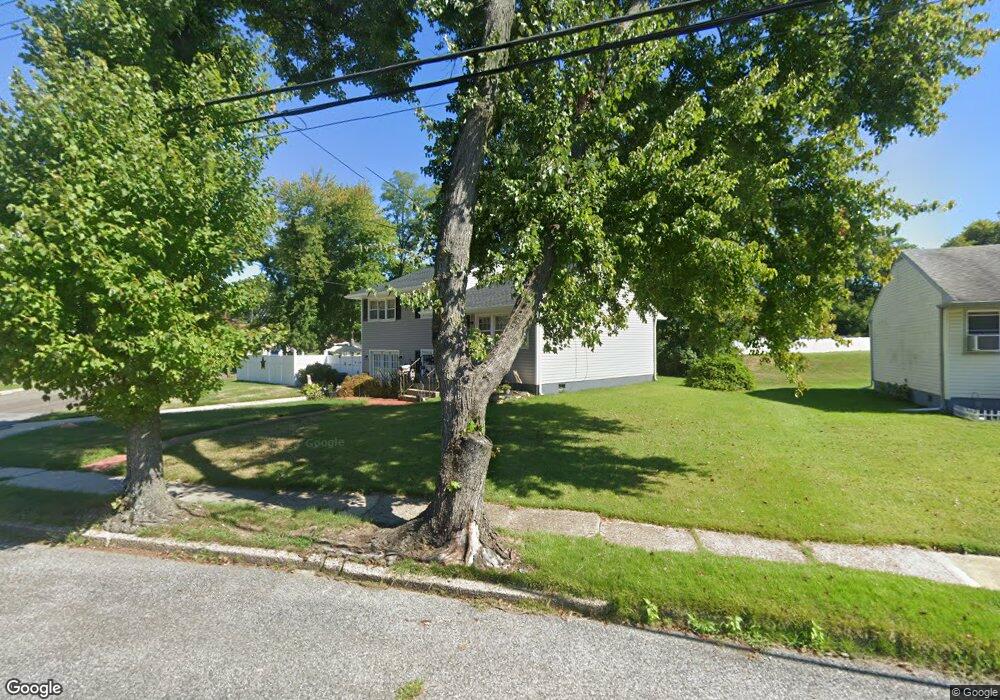
19 Goldy Dr Gloucester City, NJ 08030
Estimated Value: $288,584 - $371,000
--
Bed
--
Bath
1,515
Sq Ft
$215/Sq Ft
Est. Value
About This Home
This home is located at 19 Goldy Dr, Gloucester City, NJ 08030 and is currently estimated at $326,396, approximately $215 per square foot. 19 Goldy Dr is a home located in Camden County with nearby schools including Cold Springs School, Gloucester City Middle School, and Gloucester City Junior/Senior High School.
Ownership History
Date
Name
Owned For
Owner Type
Purchase Details
Closed on
Feb 16, 1996
Sold by
Estate Of Thomas E Young Jr
Bought by
Martin Steven J and Martin Kathleen C
Current Estimated Value
Home Financials for this Owner
Home Financials are based on the most recent Mortgage that was taken out on this home.
Original Mortgage
$92,000
Outstanding Balance
$3,019
Interest Rate
7.04%
Mortgage Type
FHA
Estimated Equity
$323,377
Create a Home Valuation Report for This Property
The Home Valuation Report is an in-depth analysis detailing your home's value as well as a comparison with similar homes in the area
Home Values in the Area
Average Home Value in this Area
Purchase History
| Date | Buyer | Sale Price | Title Company |
|---|---|---|---|
| Martin Steven J | $92,000 | -- |
Source: Public Records
Mortgage History
| Date | Status | Borrower | Loan Amount |
|---|---|---|---|
| Open | Martin Steven J | $92,000 |
Source: Public Records
Tax History Compared to Growth
Tax History
| Year | Tax Paid | Tax Assessment Tax Assessment Total Assessment is a certain percentage of the fair market value that is determined by local assessors to be the total taxable value of land and additions on the property. | Land | Improvement |
|---|---|---|---|---|
| 2025 | $8,056 | $160,700 | $65,400 | $95,300 |
| 2024 | $8,041 | $160,700 | $65,400 | $95,300 |
| 2023 | $8,041 | $160,700 | $65,400 | $95,300 |
| 2022 | $7,561 | $160,700 | $65,400 | $95,300 |
| 2021 | $7,485 | $160,700 | $65,400 | $95,300 |
| 2020 | $7,228 | $160,700 | $65,400 | $95,300 |
| 2019 | $7,080 | $160,700 | $65,400 | $95,300 |
| 2018 | $6,942 | $160,700 | $65,400 | $95,300 |
| 2017 | $6,799 | $160,700 | $65,400 | $95,300 |
| 2016 | $6,542 | $160,700 | $65,400 | $95,300 |
| 2015 | $5,891 | $160,700 | $65,400 | $95,300 |
| 2014 | $5,535 | $105,500 | $42,600 | $62,900 |
Source: Public Records
Map
Nearby Homes