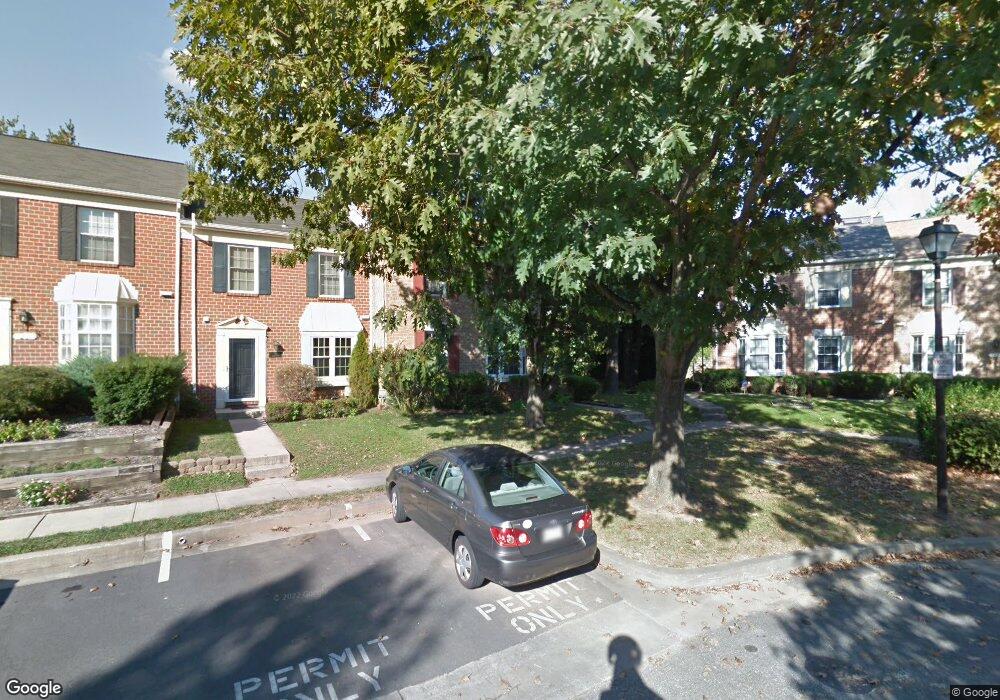
19 Hamlet Dr Owings Mills, MD 21117
Estimated Value: $295,000 - $361,000
--
Bed
3
Baths
1,496
Sq Ft
$223/Sq Ft
Est. Value
About This Home
This home is located at 19 Hamlet Dr, Owings Mills, MD 21117 and is currently estimated at $333,072, approximately $222 per square foot. 19 Hamlet Dr is a home located in Baltimore County with nearby schools including Woodholme Elementary School, Northwest Academy of Health Sciences, and Owings Mills High School.
Ownership History
Date
Name
Owned For
Owner Type
Purchase Details
Closed on
May 12, 2008
Sold by
Grebenchuk Valeriy and Grebenchuk Aneta
Bought by
Rybalnik Svetlana
Current Estimated Value
Purchase Details
Closed on
May 3, 2008
Sold by
Grebenchuk Valeriy and Grebenchuk Aneta
Bought by
Rybalnik Svetlana
Purchase Details
Closed on
Feb 12, 2004
Sold by
Grebenchuk Valeriy
Bought by
Grebenchuk Valeriy and Grebenchuk Aneta
Purchase Details
Closed on
Feb 11, 2004
Sold by
Grebenchuk Valeriy
Bought by
Grebenchuk Valeriy and Grebenchuk Aneta
Purchase Details
Closed on
Jul 27, 1998
Sold by
Goldstein Elaine B
Bought by
Grebenchuk Valeriy and Grebenchuk Aneta
Purchase Details
Closed on
Aug 3, 1994
Sold by
Silverstein Keith
Bought by
Goldstein Elaine B
Home Financials for this Owner
Home Financials are based on the most recent Mortgage that was taken out on this home.
Original Mortgage
$107,873
Interest Rate
8.4%
Create a Home Valuation Report for This Property
The Home Valuation Report is an in-depth analysis detailing your home's value as well as a comparison with similar homes in the area
Home Values in the Area
Average Home Value in this Area
Purchase History
| Date | Buyer | Sale Price | Title Company |
|---|---|---|---|
| Rybalnik Svetlana | -- | -- | |
| Rybalnik Svetlana | -- | -- | |
| Grebenchuk Valeriy | -- | -- | |
| Grebenchuk Valeriy | -- | -- | |
| Grebenchuk Valeriy | $109,500 | -- | |
| Goldstein Elaine B | $107,000 | -- |
Source: Public Records
Mortgage History
| Date | Status | Borrower | Loan Amount |
|---|---|---|---|
| Previous Owner | Goldstein Elaine B | $107,873 |
Source: Public Records
Tax History Compared to Growth
Tax History
| Year | Tax Paid | Tax Assessment Tax Assessment Total Assessment is a certain percentage of the fair market value that is determined by local assessors to be the total taxable value of land and additions on the property. | Land | Improvement |
|---|---|---|---|---|
| 2025 | $4,117 | $260,100 | $80,000 | $180,100 |
| 2024 | $4,117 | $246,333 | $0 | $0 |
| 2023 | $1,914 | $232,567 | $0 | $0 |
| 2022 | $3,491 | $218,800 | $80,000 | $138,800 |
| 2021 | $3,373 | $215,100 | $0 | $0 |
| 2020 | $3,373 | $211,400 | $0 | $0 |
| 2019 | $3,379 | $207,700 | $80,000 | $127,700 |
| 2018 | $3,178 | $198,767 | $0 | $0 |
| 2017 | $2,949 | $189,833 | $0 | $0 |
| 2016 | $2,557 | $180,900 | $0 | $0 |
| 2015 | $2,557 | $180,900 | $0 | $0 |
| 2014 | $2,557 | $180,900 | $0 | $0 |
Source: Public Records
Map
Nearby Homes
- 16 Hamlet Dr
- 8101 Greenspring Way
- 8102 Derby Ln
- 8001 Township Dr Unit 102B
- 8001 Township Dr
- 23 Greenspring Valley Rd
- 9121 Field Rd
- 0 Mcdonogh Rd Unit MDBC2128562
- 8 Greenshire Ln
- 21 Wimbledon Ln
- 9314 Countess Dr
- 14 Englefield Square
- 145 Wimbledon Ln
- 22 Royalty Cir
- 32 Royalty Cir
- 4 Chittenden Ln
- 1 Babette Ct
- 204 Berry Vine Dr
- 9450 Davy Ln Unit 466
- 4524 Reaney Ln Unit 485
- 21 Hamlet Dr
- 23 Hamlet Dr
- 25 Hamlet Dr
- 17 Hamlet Dr
- 27 Hamlet Dr
- 15 Hamlet Dr
- 13 Hamlet Dr
- 29 Hamlet Dr
- 64 Championship Ct
- 64 Championship Ct Unit 1-10
- 31 Hamlet Dr
- 11 Hamlet Dr
- 62 Championship Ct
- 33 Hamlet Dr
- 60 Championship Ct
- 9 Hamlet Dr
- 35 Hamlet Dr
- 7 Hamlet Dr
- 37 Hamlet Dr
- 29 Championship Ct Unit J-4