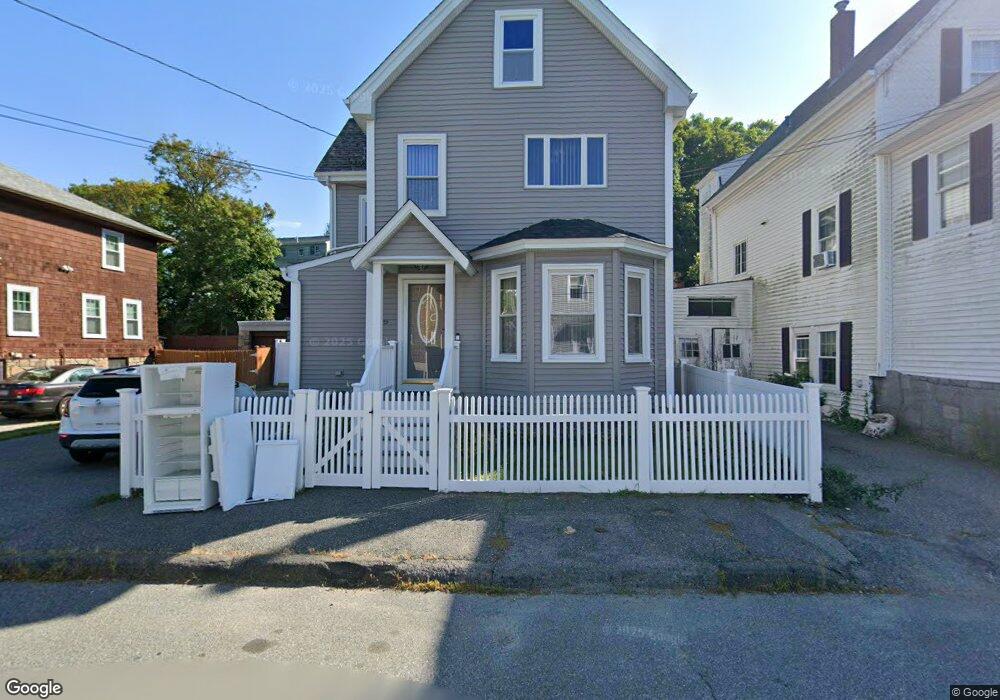
19 Hampden St Gloucester, MA 01930
Central Gloucester NeighborhoodEstimated Value: $538,000 - $694,000
4
Beds
2
Baths
1,711
Sq Ft
$363/Sq Ft
Est. Value
About This Home
This home is located at 19 Hampden St, Gloucester, MA 01930 and is currently estimated at $621,721, approximately $363 per square foot. 19 Hampden St is a home located in Essex County with nearby schools including West Parish, Ralph B O'maley Middle School, and Gloucester High School.
Ownership History
Date
Name
Owned For
Owner Type
Purchase Details
Closed on
Dec 27, 2022
Sold by
Rossi Ft
Bought by
Rossi Ft
Current Estimated Value
Purchase Details
Closed on
Apr 29, 2014
Sold by
Rossi Maria and Rossi Francesco
Bought by
Rossi Ft
Purchase Details
Closed on
Apr 27, 1992
Sold by
Pallazola Anthony and Pallazola Anne
Bought by
Rossi Francesco and Rossi Maria
Home Financials for this Owner
Home Financials are based on the most recent Mortgage that was taken out on this home.
Original Mortgage
$70,000
Interest Rate
8.78%
Mortgage Type
Purchase Money Mortgage
Create a Home Valuation Report for This Property
The Home Valuation Report is an in-depth analysis detailing your home's value as well as a comparison with similar homes in the area
Home Values in the Area
Average Home Value in this Area
Purchase History
| Date | Buyer | Sale Price | Title Company |
|---|---|---|---|
| Rossi Ft | -- | None Available | |
| Rossi Ft | -- | -- | |
| Rossi Francesco | $135,000 | -- |
Source: Public Records
Mortgage History
| Date | Status | Borrower | Loan Amount |
|---|---|---|---|
| Previous Owner | Rossi Francesco | $51,000 | |
| Previous Owner | Rossi Francesco | $68,000 | |
| Previous Owner | Rossi Francesco | $70,000 |
Source: Public Records
Tax History
| Year | Tax Paid | Tax Assessment Tax Assessment Total Assessment is a certain percentage of the fair market value that is determined by local assessors to be the total taxable value of land and additions on the property. | Land | Improvement |
|---|---|---|---|---|
| 2025 | $5,058 | $520,400 | $138,100 | $382,300 |
| 2024 | $5,000 | $513,900 | $131,600 | $382,300 |
| 2023 | $4,778 | $451,200 | $117,500 | $333,700 |
| 2022 | $4,625 | $394,300 | $102,200 | $292,100 |
| 2021 | $4,461 | $358,600 | $92,900 | $265,700 |
| 2020 | $4,383 | $355,500 | $92,900 | $262,600 |
| 2019 | $4,161 | $327,900 | $92,900 | $235,000 |
| 2018 | $3,986 | $308,300 | $92,900 | $215,400 |
| 2017 | $3,799 | $288,000 | $83,700 | $204,300 |
| 2016 | $3,628 | $266,600 | $83,600 | $183,000 |
| 2015 | $3,447 | $252,500 | $83,600 | $168,900 |
Source: Public Records
Map
Nearby Homes
- 20 Beacon St Unit 2
- 20 Beacon St Unit 1
- 84 Centennial Ave
- 55 Mansfield St Unit A
- 55 Mansfield St Unit B
- 55 Mansfield St
- 15 Harvard St
- 33 Middle St
- 33 Maplewood Ave Unit 16
- 6 Monroe Ct
- 191 Main St Unit 3
- 191 Main St Unit 2A
- 98 Maplewood Ave
- 16 Cleveland Place Unit 11
- 40 Sargent St
- 5 Marshfield St
- 19 Trask St Unit 2
- 10 Oak St Unit 3
- 160 Prospect St Unit 3
- 73 Rocky Neck Ave Unit 2
- 17 Hampden St
- 21 Hampden St
- 15 Hampden St
- 14 Babson St
- 10 Babson St Unit 2
- 13 Hampden St
- 25 Hampden St
- 23 Hampden St
- 23 Hampden St Unit 2
- 12 Babson St
- 12 Babson St Unit Furnished SHORT term
- 12 Babson St Unit 1
- 18 Hampden St
- 16 Hampden St
- 13 Gaffney St
- 14 Hampden St
- 11 Hampden St
- 8 Babson St
- 22 Hampden St
- 46 Granite St