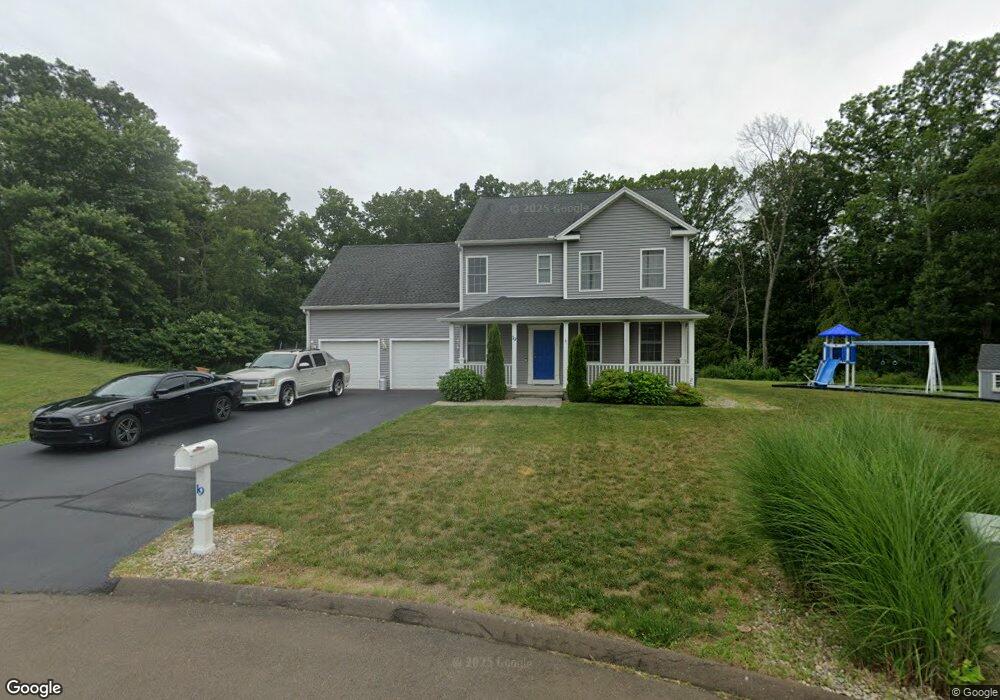
19 Hannah Dr Branford, CT 06405
Estimated Value: $665,000 - $760,817
3
Beds
3
Baths
2,305
Sq Ft
$308/Sq Ft
Est. Value
About This Home
This home is located at 19 Hannah Dr, Branford, CT 06405 and is currently estimated at $710,954, approximately $308 per square foot. 19 Hannah Dr is a home with nearby schools including Francis Walsh Intermediate School, Branford High School, and East Shoreline Catholic Academy.
Ownership History
Date
Name
Owned For
Owner Type
Purchase Details
Closed on
Jun 2, 2017
Sold by
Esm T and Yates
Bought by
Kathy Skarka T and Kathy Penn
Current Estimated Value
Purchase Details
Closed on
Feb 1, 2017
Sold by
John D & J Gwillim Ret and Gwillim
Bought by
Gwillim Kenyon D
Purchase Details
Closed on
Sep 22, 2016
Sold by
Marjorie W Hall T W and Marjorie Hall
Bought by
Hall Douglas W and Hall-Miller Jean C
Purchase Details
Closed on
Dec 7, 2015
Sold by
Tortora Gary and Provident Funding Asso
Bought by
Provident Funding Asso
Purchase Details
Closed on
Dec 4, 2015
Sold by
Savino Andrea L and Nationstar Mortgage Ll
Bought by
Nationstar Mortgage Ll
Purchase Details
Closed on
May 4, 2015
Sold by
Narcisco Robert and Provident Funding Asso
Bought by
Provident Funding Asso
Purchase Details
Closed on
Jul 19, 2012
Sold by
Vigliotti Constr Co
Bought by
Paolantonio Brett A and Paolantonio Jennifer A
Create a Home Valuation Report for This Property
The Home Valuation Report is an in-depth analysis detailing your home's value as well as a comparison with similar homes in the area
Home Values in the Area
Average Home Value in this Area
Purchase History
| Date | Buyer | Sale Price | Title Company |
|---|---|---|---|
| Paolantonio Brett A | $380,000 | -- | |
| Kathy Skarka T | -- | -- | |
| Gwillim Kenyon D | -- | -- | |
| Hall Douglas W | -- | -- | |
| Provident Funding Asso | -- | -- | |
| Nationstar Mortgage Ll | -- | -- | |
| Provident Funding Asso | -- | -- |
Source: Public Records
Tax History Compared to Growth
Tax History
| Year | Tax Paid | Tax Assessment Tax Assessment Total Assessment is a certain percentage of the fair market value that is determined by local assessors to be the total taxable value of land and additions on the property. | Land | Improvement |
|---|---|---|---|---|
| 2025 | $10,034 | $468,900 | $109,300 | $359,600 |
| 2024 | $8,982 | $294,700 | $91,800 | $202,900 |
| 2023 | $8,809 | $294,700 | $91,800 | $202,900 |
| 2022 | $8,679 | $294,700 | $91,800 | $202,900 |
| 2021 | $8,679 | $294,700 | $91,800 | $202,900 |
| 2020 | $8,523 | $294,700 | $91,800 | $202,900 |
| 2019 | $7,910 | $272,100 | $91,800 | $180,300 |
| 2018 | $7,504 | $262,000 | $91,800 | $170,200 |
| 2017 | $7,459 | $262,000 | $91,800 | $170,200 |
| 2016 | $7,181 | $262,000 | $91,800 | $170,200 |
| 2015 | $7,056 | $262,000 | $91,800 | $170,200 |
| 2014 | $7,019 | $267,500 | $95,600 | $171,900 |
Source: Public Records
Map
Nearby Homes
- 107 Chestnut St
- 251 N Main St
- 21 Manorwood Dr Unit 21
- 22 Hickory Hill Ln
- 27 Hickory Hill Ln
- 85 Ivy St
- 226 Austin Ryer Ln Unit 226
- 240 Austin Ryer Ln Unit 240
- 113 Island View Terrace
- 53 Brushy Plain Rd Unit 4E
- 53 Brushy Plain Rd Unit 3D
- 49 Riverside Dr
- 24 River Walk
- 26 Cedar Knolls Dr
- 16 Pine Orchard Rd Unit 23
- 13 Pond View Terrace
- 180 Cherry Hill Rd Unit Lot 5
- 184 Cherry Hill Rd Unit Lot 4
- 8 Autumn Ridge Rd
- 25 S Montowese St
- 12 Hannah Dr
- 15 Hannah Dr
- 150 N Chestnut St
- 8 Hannah Dr
- Lot 10 Hannah Dr
- Lot 7 Hannah Dr
- Lot 9 Hannah Dr
- Lot 11 Hannah Dr
- Lot 6 Hannah Dr
- Lot 8 Hannah
- 5 Hannah Dr
- 4 Hannah Dr
- 143 N Chestnut St
- 149 N Chestnut St
- 153 N Chestnut St
- 157 N Chestnut St
- 176 N Chestnut St
- 161 N Chestnut St
- 139 N Chestnut St
- 132 N Chestnut St