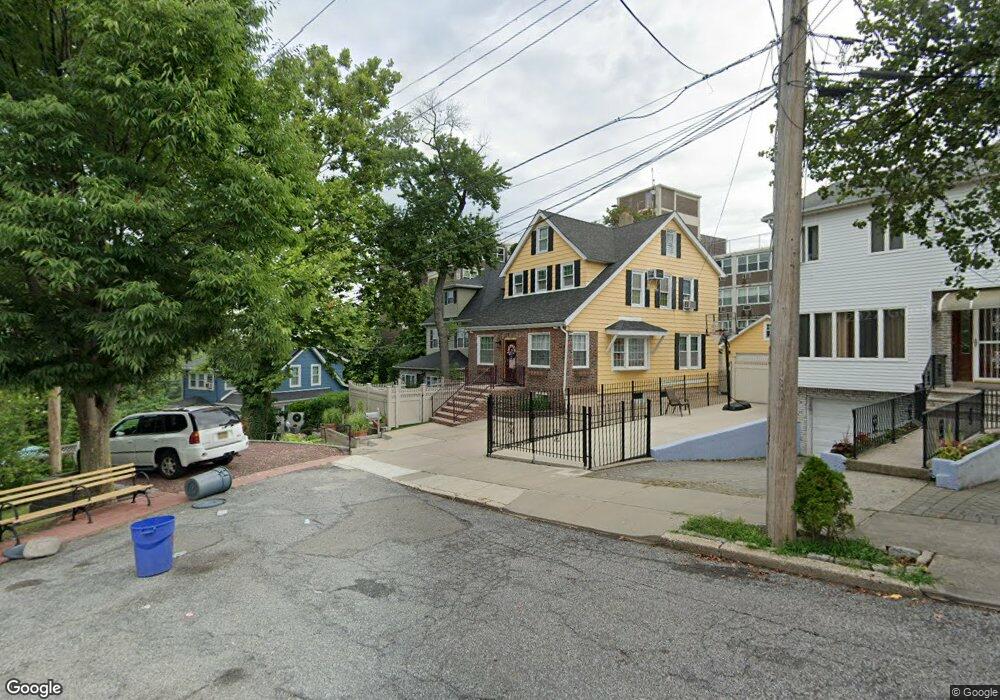
19 Harbor View Ct Staten Island, NY 10301
Tompkinsville NeighborhoodEstimated Value: $635,876 - $755,000
3
Beds
3
Baths
2,048
Sq Ft
$345/Sq Ft
Est. Value
About This Home
This home is located at 19 Harbor View Ct, Staten Island, NY 10301 and is currently estimated at $706,469, approximately $344 per square foot. 19 Harbor View Ct is a home located in Richmond County with nearby schools including P.S. 45 John Tyler, Is 61 William A Morris, and Curtis High School.
Ownership History
Date
Name
Owned For
Owner Type
Purchase Details
Closed on
Aug 24, 2000
Sold by
Nixon Keith and Nixon Donna
Bought by
Soriano Joseph
Current Estimated Value
Home Financials for this Owner
Home Financials are based on the most recent Mortgage that was taken out on this home.
Original Mortgage
$187,200
Outstanding Balance
$67,158
Interest Rate
8.07%
Mortgage Type
Purchase Money Mortgage
Estimated Equity
$639,311
Create a Home Valuation Report for This Property
The Home Valuation Report is an in-depth analysis detailing your home's value as well as a comparison with similar homes in the area
Home Values in the Area
Average Home Value in this Area
Purchase History
| Date | Buyer | Sale Price | Title Company |
|---|---|---|---|
| Soriano Joseph | $193,000 | Fidelity National Title Ins |
Source: Public Records
Mortgage History
| Date | Status | Borrower | Loan Amount |
|---|---|---|---|
| Open | Soriano Joseph | $187,200 | |
| Closed | Soriano Joseph | $187,200 |
Source: Public Records
Tax History
| Year | Tax Paid | Tax Assessment Tax Assessment Total Assessment is a certain percentage of the fair market value that is determined by local assessors to be the total taxable value of land and additions on the property. | Land | Improvement |
|---|---|---|---|---|
| 2025 | $5,916 | $35,160 | $12,845 | $22,315 |
| 2024 | $5,928 | $32,580 | $13,411 | $19,169 |
| 2023 | $5,781 | $29,866 | $13,004 | $16,862 |
| 2022 | $5,338 | $29,280 | $14,160 | $15,120 |
| 2021 | $5,291 | $26,580 | $14,160 | $12,420 |
| 2020 | $5,446 | $29,400 | $14,160 | $15,240 |
| 2019 | $5,086 | $27,780 | $14,160 | $13,620 |
| 2018 | $4,925 | $25,620 | $14,160 | $11,460 |
| 2017 | $4,764 | $24,841 | $13,729 | $11,112 |
| 2016 | $3,968 | $21,398 | $12,915 | $8,483 |
| 2015 | $3,462 | $20,805 | $13,166 | $7,639 |
| 2014 | $3,462 | $19,629 | $10,626 | $9,003 |
Source: Public Records
Map
Nearby Homes
- 0 Stanley Ave
- 164 Brighton Ave
- 303 Glen Ave
- 139 Brighton Ave
- 130 Brighton Ave
- 331 Glen Ave
- 260 Brighton Ave
- 125 Brighton Ave
- 226 Castleton Ave
- 99 Stanley Ave
- 333 Lafayette Ave
- 59 Oxford Place
- 310 Brighton Ave
- 116 Silver Lake Rd
- 293 Lafayette Ave
- 414 Castleton Ave
- 110 Arnold St
- 41 Pine St
- 104 Arnold St
- 171 Silver Lake Rd
- 17 Harbor View Ct
- 26 Harbor View Ct
- 9 Harbor View Ct
- 275 Castleton Ave
- 7 Harbor View Ct
- 210 Stanley Ave
- 216 Stanley Ave
- 22 Harbor View Ct
- 5 Harbor View Ct
- 20 Harbor View Ct
- 184 Stanley Ave
- 18 Harbor View Ct Unit 158
- 18 Harbor View Ct Unit A
- 18A Harbor View Ct
- 12 Harbor View Ct
- 16 Harbor View Ct
- 199 Stanley Ave
- 10 Harbor View Ct
- 297 Castleton Ave
- 297 Castleton Ave Unit 2