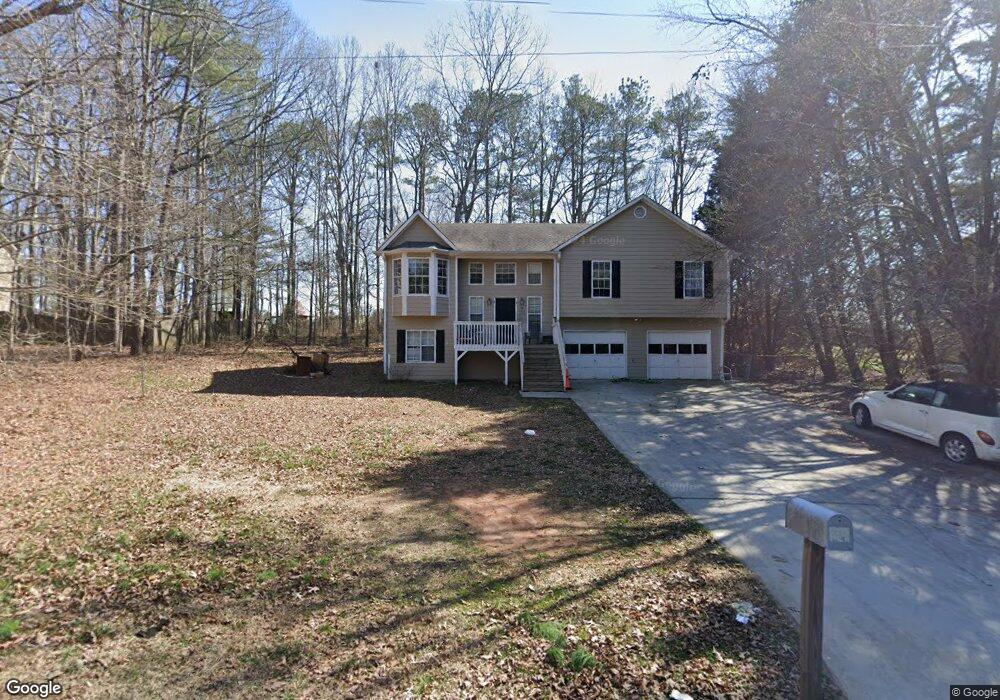
19 Herrell Dr Villa Rica, GA 30180
Estimated Value: $278,277 - $327,000
3
Beds
3
Baths
1,440
Sq Ft
$208/Sq Ft
Est. Value
About This Home
This home is located at 19 Herrell Dr, Villa Rica, GA 30180 and is currently estimated at $299,069, approximately $207 per square foot. 19 Herrell Dr is a home located in Carroll County with nearby schools including Villa Rica Elementary School, Villa Rica Middle School, and Villa Rica High School.
Ownership History
Date
Name
Owned For
Owner Type
Purchase Details
Closed on
Apr 9, 2013
Sold by
Tholl Jill M
Bought by
Harris Walker Properties Llc
Current Estimated Value
Purchase Details
Closed on
Dec 16, 2011
Bought by
Tholl Jill M
Purchase Details
Closed on
Jun 7, 2011
Sold by
Thi Le Thang H
Bought by
Wells Fargo Bank Na
Purchase Details
Closed on
Apr 30, 2004
Sold by
Regions Bank
Bought by
Thi Le Thang H
Purchase Details
Closed on
Oct 7, 2003
Sold by
Orourke Jennifer
Bought by
Regions Bank
Purchase Details
Closed on
Jun 1, 2000
Sold by
Orourke Rodney W
Bought by
Orourke Jennifer
Purchase Details
Closed on
Nov 6, 1997
Sold by
Hitchcock D L
Bought by
Orourke Rodney W
Create a Home Valuation Report for This Property
The Home Valuation Report is an in-depth analysis detailing your home's value as well as a comparison with similar homes in the area
Home Values in the Area
Average Home Value in this Area
Purchase History
| Date | Buyer | Sale Price | Title Company |
|---|---|---|---|
| Harris Walker Properties Llc | $50,000 | -- | |
| Tholl Jill M | $38,000 | -- | |
| Wells Fargo Bank Na | $41,400 | -- | |
| Thi Le Thang H | $106,000 | -- | |
| Regions Bank | $90,700 | -- | |
| Orourke Jennifer | -- | -- | |
| Orourke Rodney W | $95,000 | -- |
Source: Public Records
Tax History Compared to Growth
Tax History
| Year | Tax Paid | Tax Assessment Tax Assessment Total Assessment is a certain percentage of the fair market value that is determined by local assessors to be the total taxable value of land and additions on the property. | Land | Improvement |
|---|---|---|---|---|
| 2024 | $2,361 | $104,362 | $8,000 | $96,362 |
| 2023 | $2,361 | $96,202 | $8,000 | $88,202 |
| 2022 | $1,976 | $78,790 | $8,000 | $70,790 |
| 2021 | $1,757 | $68,518 | $8,000 | $60,518 |
| 2020 | $1,615 | $62,914 | $8,000 | $54,914 |
| 2019 | $1,533 | $59,232 | $8,000 | $51,232 |
| 2018 | $1,411 | $53,718 | $8,000 | $45,718 |
| 2017 | $1,415 | $53,718 | $8,000 | $45,718 |
| 2016 | $1,415 | $53,718 | $8,000 | $45,718 |
| 2015 | $1,251 | $44,745 | $8,000 | $36,745 |
| 2014 | $562 | $44,745 | $8,000 | $36,745 |
Source: Public Records
Map
Nearby Homes