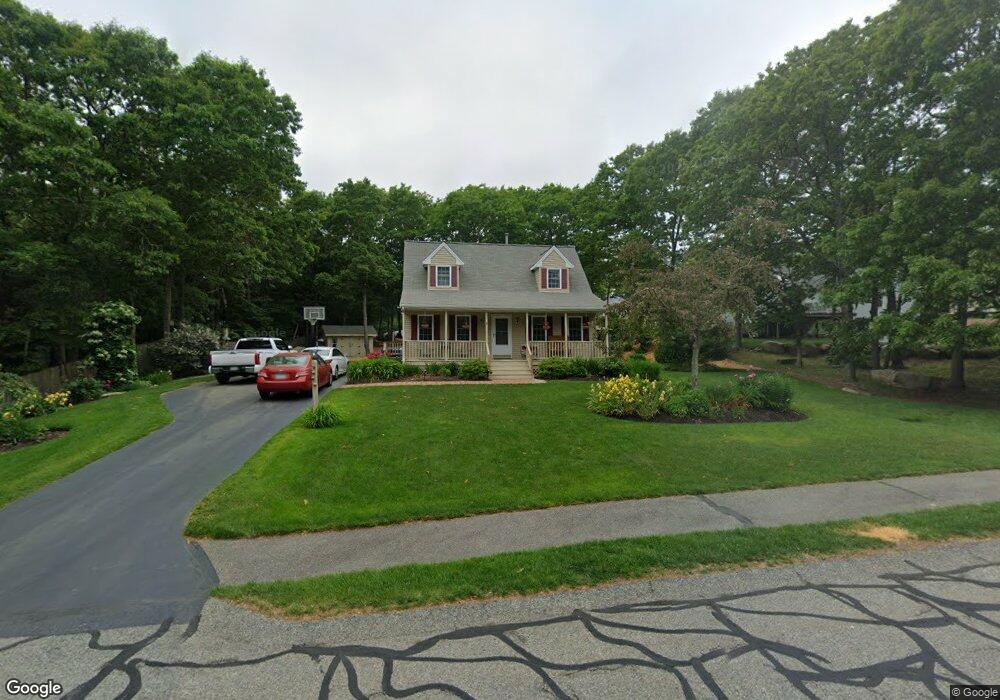
19 High Ridge Dr Bourne, MA 2532
Estimated Value: $587,000 - $659,000
3
Beds
3
Baths
1,344
Sq Ft
$466/Sq Ft
Est. Value
About This Home
This home is located at 19 High Ridge Dr, Bourne, MA 2532 and is currently estimated at $626,024, approximately $465 per square foot. 19 High Ridge Dr is a home located in Barnstable County with nearby schools including Bourne High School and St Margaret Regional School.
Ownership History
Date
Name
Owned For
Owner Type
Purchase Details
Closed on
Nov 3, 1998
Sold by
Nightingale Ltd Divid
Bought by
Lovering Marc S and Lovering Lisa S
Current Estimated Value
Create a Home Valuation Report for This Property
The Home Valuation Report is an in-depth analysis detailing your home's value as well as a comparison with similar homes in the area
Purchase History
| Date | Buyer | Sale Price | Title Company |
|---|---|---|---|
| Lovering Marc S | $150,100 | -- | |
| Lovering Marc S | $150,100 | -- |
Source: Public Records
Mortgage History
| Date | Status | Borrower | Loan Amount |
|---|---|---|---|
| Open | Lovering Marc S | $121,100 | |
| Closed | Lovering Marc S | $162,000 | |
| Closed | Lovering Marc S | $144,900 |
Source: Public Records
Tax History
| Year | Tax Paid | Tax Assessment Tax Assessment Total Assessment is a certain percentage of the fair market value that is determined by local assessors to be the total taxable value of land and additions on the property. | Land | Improvement |
|---|---|---|---|---|
| 2025 | $3,805 | $487,200 | $215,200 | $272,000 |
| 2024 | $3,747 | $467,200 | $205,000 | $262,200 |
| 2023 | $3,788 | $430,000 | $197,900 | $232,100 |
| 2022 | $3,652 | $361,900 | $175,100 | $186,800 |
| 2021 | $3,572 | $331,700 | $159,400 | $172,300 |
| 2020 | $3,398 | $316,400 | $157,900 | $158,500 |
| 2019 | $3,233 | $307,600 | $157,900 | $149,700 |
| 2018 | $3,053 | $289,700 | $150,400 | $139,300 |
| 2017 | $2,923 | $283,800 | $142,700 | $141,100 |
| 2016 | $2,721 | $267,800 | $130,300 | $137,500 |
| 2015 | $2,634 | $261,600 | $124,100 | $137,500 |
Source: Public Records
Map
Nearby Homes
- 304 Main St
- 58 Maple St
- 16 Weather Deck Rd
- 6 Honora Ln
- 3 Honora Ln Unit 3
- 24 Ships View Terrace
- 38 Old Bridge Rd
- 29 Weather Deck Rd
- 6 Wall St
- 60 Sandwich Rd
- 46 Holt Rd Unit A
- 46 Holt Rd Unit B
- 46 Holt Rd
- 810 Head of The Bay Rd
- 44 Cotuit Rd
- 9 Hideaway Rd Unit F
- 13 Hideaway Village Unit G
- 40-A Lafayette Ave
- 4 Van Bummel Rd
- 6 Aspen Rd
- 19 High Ridge Dr
- 7 Cutters Sound Dr
- 7 Cutters Sound Dr
- 17 High Ridge Dr
- 9 Cutters Sound Dr
- 9 Cutters Sound Dr
- 5 Cutters Sound Dr
- 5 Cutters Sound Dr
- 8 Whitecliff Rd
- 20 High Ridge Dr
- 8 Whitecliff Rd
- 6 Whitecliff Rd
- 16 High Ridge Dr
- 15 High Ridge Dr
- 22 High Ridge Dr
- 10 Cutters Sound Dr
- 6 Whitecliff Rd
- 10 Cutters Sound Dr
- 6 White Cliff Rd
- 8 Cutters Sound Dr
Your Personal Tour Guide
Ask me questions while you tour the home.