Estimated Value: $1,470,818 - $1,968,000
5
Beds
6
Baths
4,331
Sq Ft
$403/Sq Ft
Est. Value
About This Home
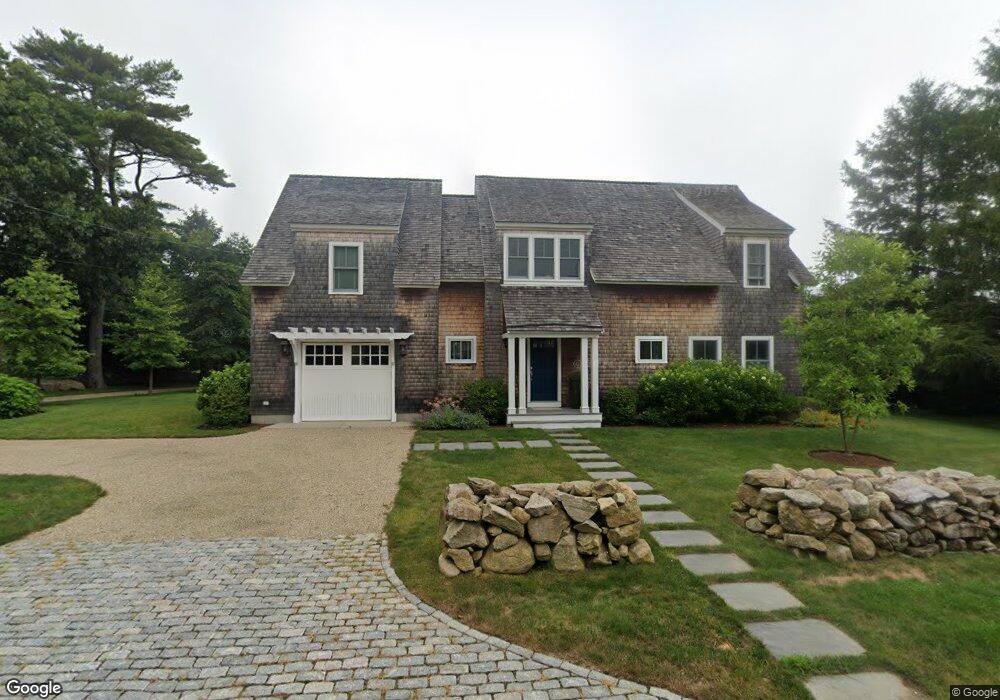
This home is located at 19 High St, Dartmouth, MA 02748 and is currently estimated at $1,745,606, approximately $403 per square foot. 19 High St is a home located in Bristol County with nearby schools including Dartmouth High School and St. Teresa of Calcutta School.
Ownership History
Date
Name
Owned For
Owner Type
Purchase Details
Closed on
Jul 3, 2003
Sold by
Rounds Eve S and Rounds Jonathan L
Bought by
Mass Commof Electric C and Verizon Ne Inc
Current Estimated Value
Purchase Details
Closed on
May 28, 1999
Sold by
Salten Phoebe
Bought by
Rounds Jonathan L and Rounds Eve S
Home Financials for this Owner
Home Financials are based on the most recent Mortgage that was taken out on this home.
Original Mortgage
$400,000
Interest Rate
6.82%
Mortgage Type
Purchase Money Mortgage
Create a Home Valuation Report for This Property
The Home Valuation Report is an in-depth analysis detailing your home's value as well as a comparison with similar homes in the area
Home Values in the Area
Average Home Value in this Area
Purchase History
| Date | Buyer | Sale Price | Title Company |
|---|---|---|---|
| Mass Commof Electric C | -- | -- | |
| Rounds Jonathan L | $620,000 | -- |
Source: Public Records
Mortgage History
| Date | Status | Borrower | Loan Amount |
|---|---|---|---|
| Previous Owner | Rounds Jonathan L | $400,000 | |
| Previous Owner | Rounds Jonathan L | $100,000 |
Source: Public Records
Tax History Compared to Growth
Tax History
| Year | Tax Paid | Tax Assessment Tax Assessment Total Assessment is a certain percentage of the fair market value that is determined by local assessors to be the total taxable value of land and additions on the property. | Land | Improvement |
|---|---|---|---|---|
| 2025 | $9,396 | $1,091,300 | $546,000 | $545,300 |
| 2024 | $9,330 | $1,073,600 | $546,000 | $527,600 |
| 2023 | $9,519 | $1,038,100 | $546,000 | $492,100 |
| 2022 | $8,857 | $894,600 | $498,000 | $396,600 |
| 2021 | $9,094 | $877,800 | $495,100 | $382,700 |
| 2020 | $9,644 | $929,100 | $549,800 | $379,300 |
| 2019 | $9,475 | $911,100 | $549,800 | $361,300 |
| 2018 | $6,496 | $632,900 | $549,800 | $83,100 |
| 2017 | $6,019 | $600,700 | $518,800 | $81,900 |
| 2016 | $6,098 | $600,200 | $518,800 | $81,400 |
| 2015 | $5,526 | $545,000 | $462,200 | $82,800 |
| 2014 | $3,999 | $391,700 | $310,400 | $81,300 |
Source: Public Records
Map
Nearby Homes
- 23 High St
- 40 School St
- 0 Stoneledge Rd
- 00 Prospect St
- 2 Spinnaker Ln
- 48 Wilson St
- 76 Shipyard Ln
- 21 Avis St
- 59 Hidden Bay Dr
- 212 Rockland St
- 44 Arrowhead Ln
- 161 Portland St
- 15 Puritan St
- 220 Aquidneck St
- 75 Country Way Unit 75
- 166 Charles St
- 105 Rock Odundee Rd
- 3 Mishawum Dr
- 25 Seaview Terrace
- 5 Samosett Dr