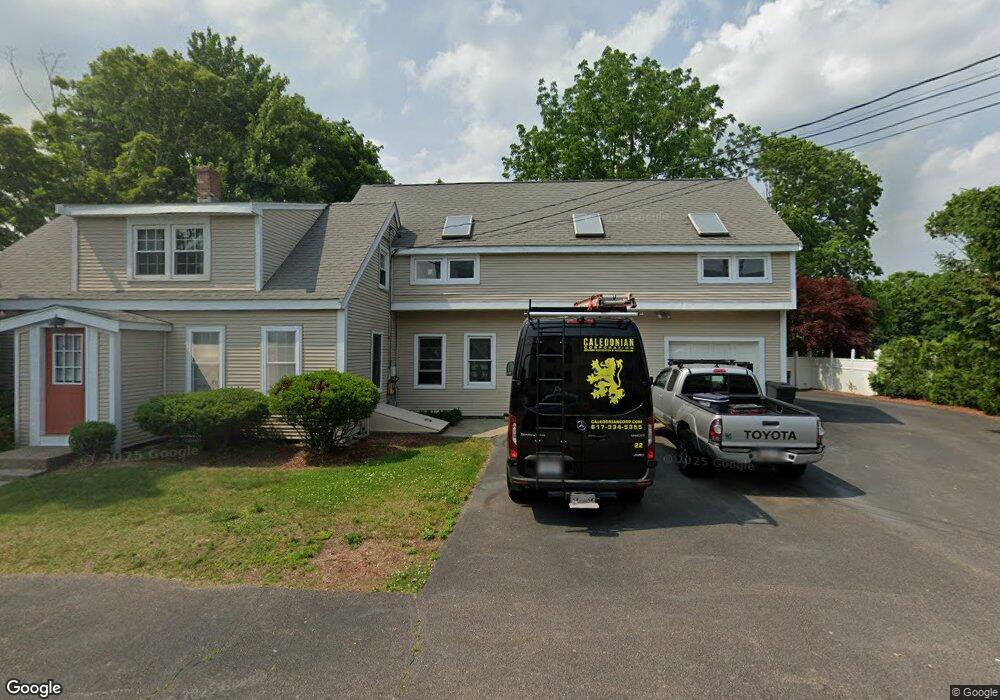
19 High St West Bridgewater, MA 02379
Estimated Value: $560,000 - $657,000
3
Beds
3
Baths
2,732
Sq Ft
$229/Sq Ft
Est. Value
About This Home
This home is located at 19 High St, West Bridgewater, MA 02379 and is currently estimated at $624,561, approximately $228 per square foot. 19 High St is a home located in Plymouth County with nearby schools including Spring Street Elementary School, Howard Elementary School, and Rose L. MacDonald Elementary School.
Ownership History
Date
Name
Owned For
Owner Type
Purchase Details
Closed on
Apr 25, 2002
Sold by
Pepsak Lisa J and Pepsak Brian M
Bought by
Oneill Ryan E and Oneill David P
Current Estimated Value
Purchase Details
Closed on
May 26, 1995
Sold by
Crescent Cu
Bought by
Pepsak Brian M and Scully Lisa J
Purchase Details
Closed on
Jan 12, 1995
Sold by
Thompson David R and Thompson Michelle A
Bought by
Crescent Cu
Create a Home Valuation Report for This Property
The Home Valuation Report is an in-depth analysis detailing your home's value as well as a comparison with similar homes in the area
Home Values in the Area
Average Home Value in this Area
Purchase History
| Date | Buyer | Sale Price | Title Company |
|---|---|---|---|
| Oneill Ryan E | $332,000 | -- | |
| Pepsak Brian M | $105,300 | -- | |
| Crescent Cu | $152,000 | -- |
Source: Public Records
Mortgage History
| Date | Status | Borrower | Loan Amount |
|---|---|---|---|
| Open | Crescent Cu | $315,000 | |
| Closed | Crescent Cu | $328,000 |
Source: Public Records
Tax History Compared to Growth
Tax History
| Year | Tax Paid | Tax Assessment Tax Assessment Total Assessment is a certain percentage of the fair market value that is determined by local assessors to be the total taxable value of land and additions on the property. | Land | Improvement |
|---|---|---|---|---|
| 2025 | $7,494 | $548,200 | $205,500 | $342,700 |
| 2024 | $7,081 | $499,700 | $186,300 | $313,400 |
| 2023 | $6,558 | $426,700 | $161,400 | $265,300 |
| 2022 | $5,977 | $368,500 | $151,800 | $216,700 |
| 2021 | $6,001 | $359,100 | $151,800 | $207,300 |
| 2020 | $5,878 | $359,100 | $151,800 | $207,300 |
| 2019 | $6,528 | $359,100 | $151,800 | $207,300 |
| 2018 | $5,796 | $342,200 | $144,100 | $198,100 |
| 2017 | $5,945 | $319,200 | $130,600 | $188,600 |
| 2016 | $5,580 | $310,000 | $121,400 | $188,600 |
| 2015 | $5,589 | $313,800 | $121,400 | $192,400 |
| 2014 | $5,109 | $309,800 | $121,400 | $188,400 |
Source: Public Records
Map
Nearby Homes
- 282 Crescent St
- 279 Crescent St
- 260 Crescent St
- 323 S Elm St
- 227 S Elm Lot2
- 122 N Elm St
- 10 Charles St
- 29 Ellis Ave
- 37 Metacomet Rd Unit 37
- 58 Metacomet Rd Unit 17
- 44 Metacomet Rd Unit 44
- 46 Metacomet Rd Unit 46
- 42 Metacomet Rd Unit 42
- 20 Metacomet Rd Unit 20
- The Meadow View B Plan at Cochesett Estates
- 16 Metacomet Rd Unit 16
- The Liverpool Plan at Cochesett Estates
- The Woolton Plan at Cochesett Estates
- Meadow View A Plan at Cochesett Estates
- 281 Spring St