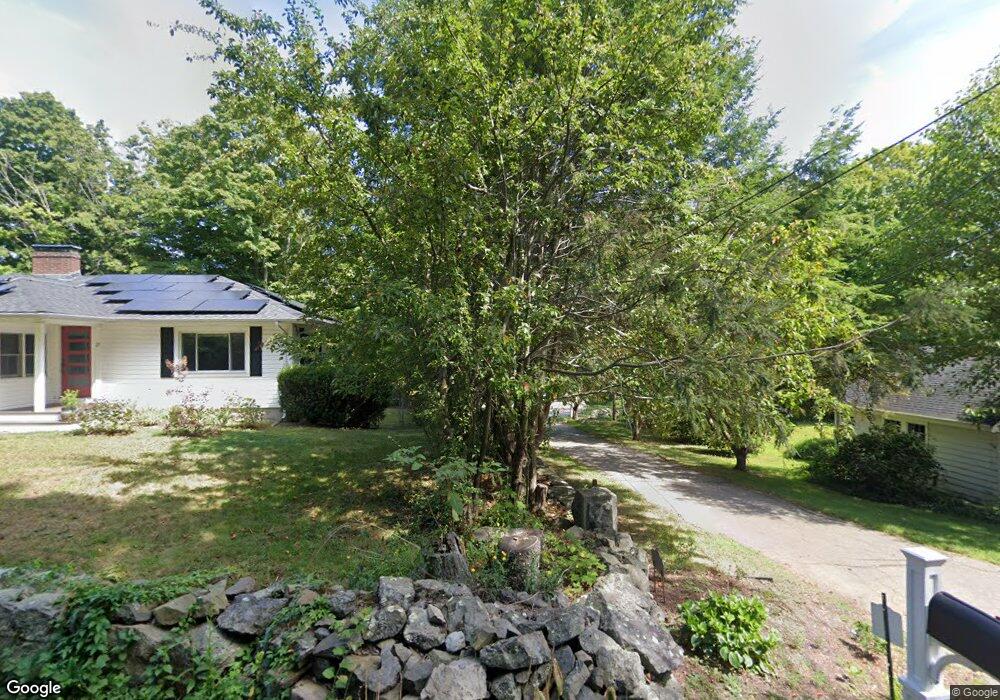
19 Hyde St Weymouth, MA 02188
East Weymouth NeighborhoodEstimated Value: $843,000 - $978,000
4
Beds
3
Baths
2,728
Sq Ft
$332/Sq Ft
Est. Value
About This Home
This home is located at 19 Hyde St, Weymouth, MA 02188 and is currently estimated at $905,055, approximately $331 per square foot. 19 Hyde St is a home located in Norfolk County with nearby schools including Abigail Adams Middle School, Academy Avenue Elementary School, and Weymouth Middle School Chapman.
Ownership History
Date
Name
Owned For
Owner Type
Purchase Details
Closed on
Mar 27, 2002
Sold by
Hazen Tr Norman
Bought by
Welch Patrick J and Welch Anne L
Current Estimated Value
Home Financials for this Owner
Home Financials are based on the most recent Mortgage that was taken out on this home.
Original Mortgage
$277,500
Outstanding Balance
$115,611
Interest Rate
6.88%
Mortgage Type
Purchase Money Mortgage
Estimated Equity
$789,444
Create a Home Valuation Report for This Property
The Home Valuation Report is an in-depth analysis detailing your home's value as well as a comparison with similar homes in the area
Home Values in the Area
Average Home Value in this Area
Purchase History
| Date | Buyer | Sale Price | Title Company |
|---|---|---|---|
| Welch Patrick J | $375,000 | -- |
Source: Public Records
Mortgage History
| Date | Status | Borrower | Loan Amount |
|---|---|---|---|
| Open | Welch Patrick J | $277,500 |
Source: Public Records
Tax History
| Year | Tax Paid | Tax Assessment Tax Assessment Total Assessment is a certain percentage of the fair market value that is determined by local assessors to be the total taxable value of land and additions on the property. | Land | Improvement |
|---|---|---|---|---|
| 2025 | $8,829 | $874,200 | $261,200 | $613,000 |
| 2024 | $8,648 | $842,100 | $248,800 | $593,300 |
| 2023 | $8,323 | $796,500 | $230,400 | $566,100 |
| 2022 | $8,059 | $703,200 | $213,300 | $489,900 |
| 2021 | $8,022 | $683,300 | $213,300 | $470,000 |
| 2020 | $7,978 | $669,300 | $213,300 | $456,000 |
| 2019 | $7,856 | $648,200 | $205,100 | $443,100 |
| 2018 | $7,588 | $607,000 | $195,400 | $411,600 |
| 2017 | $7,487 | $584,500 | $186,300 | $398,200 |
| 2016 | $7,080 | $553,100 | $202,600 | $350,500 |
| 2015 | $5,943 | $460,700 | $202,600 | $258,100 |
| 2014 | $5,704 | $428,900 | $188,500 | $240,400 |
Source: Public Records
Map
Nearby Homes
- 70 Biscayne Ave
- 70 Colonial Rd
- 211 Roosevelt Rd
- 10 Marion Rd
- 49 Cornish St
- 46 Roosevelt Rd
- 78 Middle St
- 148 Chard St
- 29-31 Broad Street Place
- 16 Beechwood Rd
- 90 Sea St Unit 204
- 19 Vine St Unit 3
- 19 Vine St Unit 2
- 25 Richmond St
- 237 North St Unit A
- 11 Richmond St
- 5 Endicott St
- 122 Washington St Unit Twenty-two
- 54 Edgemont Rd
- 30 Puritan Rd
- 55 Hyde St
- 25 Hyde St
- 35 Hyde St
- 15 Hyde St
- 546 Commercial St
- 540 Commercial St
- 28 Hyde St
- 556 Commercial St
- 14 Hyde St
- 54 Meeting House Ln
- 42 Meeting House Ln
- 526 Commercial St
- 570 Commercial St
- 36 Hyde St
- 520 Commercial St
- 48 Hyde St
- 541 Commercial St
- 53 Meeting House Ln
- 533 Commercial St
- 32 Meeting House Ln
Your Personal Tour Guide
Ask me questions while you tour the home.