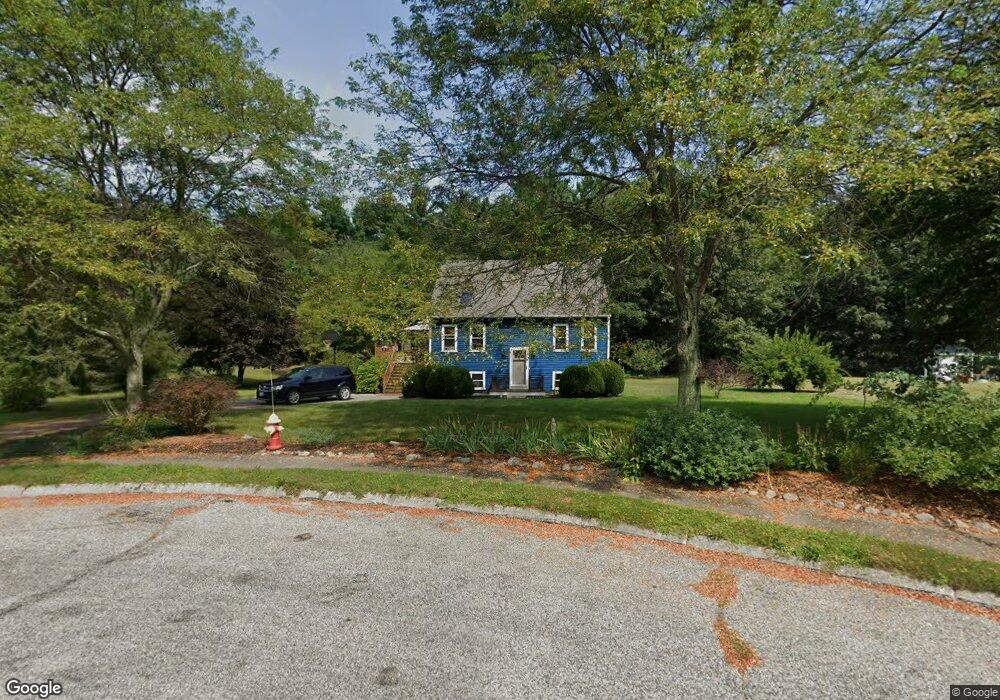
19 Ingrid Dr Mansfield, MA 02048
Estimated Value: $512,000 - $651,000
3
Beds
2
Baths
1,267
Sq Ft
$466/Sq Ft
Est. Value
About This Home
This home is located at 19 Ingrid Dr, Mansfield, MA 02048 and is currently estimated at $590,339, approximately $465 per square foot. 19 Ingrid Dr is a home located in Bristol County with nearby schools including Everett W. Robinson Elementary School, Jordan/Jackson Elementary School, and Harold L. Qualters Middle School.
Ownership History
Date
Name
Owned For
Owner Type
Purchase Details
Closed on
Dec 24, 1990
Sold by
Harrington & Matto Co
Bought by
Schow Robert W
Current Estimated Value
Home Financials for this Owner
Home Financials are based on the most recent Mortgage that was taken out on this home.
Original Mortgage
$145,430
Interest Rate
10.02%
Mortgage Type
Purchase Money Mortgage
Create a Home Valuation Report for This Property
The Home Valuation Report is an in-depth analysis detailing your home's value as well as a comparison with similar homes in the area
Home Values in the Area
Average Home Value in this Area
Purchase History
| Date | Buyer | Sale Price | Title Company |
|---|---|---|---|
| Schow Robert W | $153,151 | -- |
Source: Public Records
Mortgage History
| Date | Status | Borrower | Loan Amount |
|---|---|---|---|
| Open | Schow Robert W | $165,000 | |
| Closed | Schow Robert W | $142,000 | |
| Closed | Schow Robert W | $147,393 | |
| Closed | Schow Robert W | $145,430 |
Source: Public Records
Tax History Compared to Growth
Tax History
| Year | Tax Paid | Tax Assessment Tax Assessment Total Assessment is a certain percentage of the fair market value that is determined by local assessors to be the total taxable value of land and additions on the property. | Land | Improvement |
|---|---|---|---|---|
| 2025 | $6,136 | $465,900 | $242,200 | $223,700 |
| 2024 | $5,731 | $424,500 | $231,100 | $193,400 |
| 2023 | $5,299 | $376,100 | $231,100 | $145,000 |
| 2022 | $5,168 | $340,700 | $214,000 | $126,700 |
| 2021 | $5,932 | $386,200 | $203,800 | $182,400 |
| 2020 | $5,293 | $344,600 | $178,400 | $166,200 |
| 2019 | $5,163 | $339,200 | $169,800 | $169,400 |
| 2018 | $5,158 | $331,300 | $161,900 | $169,400 |
| 2017 | $5,056 | $336,600 | $157,400 | $179,200 |
| 2016 | $4,805 | $311,800 | $149,800 | $162,000 |
| 2015 | $4,343 | $280,200 | $149,800 | $130,400 |
Source: Public Records
Map
Nearby Homes