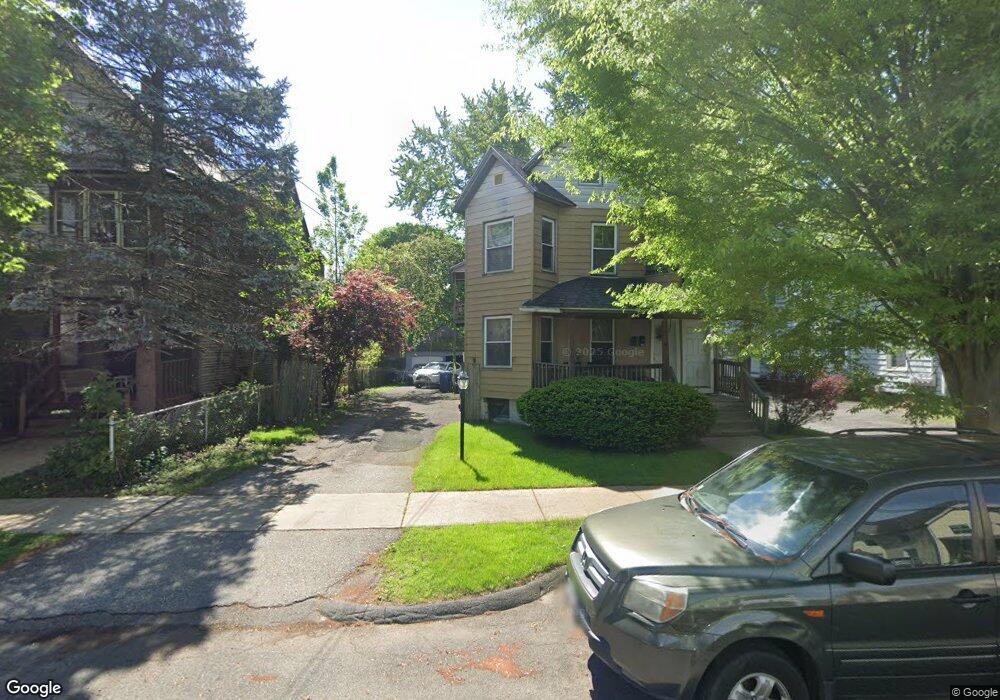
19 Irving St West Springfield, MA 01089
Estimated Value: $320,751 - $462,000
4
Beds
2
Baths
2,800
Sq Ft
$139/Sq Ft
Est. Value
About This Home
This home is located at 19 Irving St, West Springfield, MA 01089 and is currently estimated at $389,688, approximately $139 per square foot. 19 Irving St is a home located in Hampden County with nearby schools including Hampden Charter School of Science West.
Ownership History
Date
Name
Owned For
Owner Type
Purchase Details
Closed on
Dec 15, 2006
Sold by
Reliable Hm Solutions
Bought by
Williams George J
Current Estimated Value
Home Financials for this Owner
Home Financials are based on the most recent Mortgage that was taken out on this home.
Original Mortgage
$169,225
Outstanding Balance
$101,176
Interest Rate
6.31%
Mortgage Type
Purchase Money Mortgage
Estimated Equity
$288,512
Purchase Details
Closed on
Jul 14, 2006
Sold by
Iinicky Susan
Bought by
Reliable Home Solut In
Purchase Details
Closed on
Nov 17, 2003
Sold by
Michaud Claire
Bought by
Ilnicky Susan
Home Financials for this Owner
Home Financials are based on the most recent Mortgage that was taken out on this home.
Original Mortgage
$105,300
Interest Rate
5.81%
Mortgage Type
Purchase Money Mortgage
Create a Home Valuation Report for This Property
The Home Valuation Report is an in-depth analysis detailing your home's value as well as a comparison with similar homes in the area
Home Values in the Area
Average Home Value in this Area
Purchase History
| Date | Buyer | Sale Price | Title Company |
|---|---|---|---|
| Williams George J | $175,500 | -- | |
| Reliable Home Solut In | $115,943 | -- | |
| Ilnicky Susan | $117,000 | -- |
Source: Public Records
Mortgage History
| Date | Status | Borrower | Loan Amount |
|---|---|---|---|
| Open | Williams George J | $169,225 | |
| Previous Owner | Ilnicky Susan | $105,300 |
Source: Public Records
Tax History Compared to Growth
Tax History
| Year | Tax Paid | Tax Assessment Tax Assessment Total Assessment is a certain percentage of the fair market value that is determined by local assessors to be the total taxable value of land and additions on the property. | Land | Improvement |
|---|---|---|---|---|
| 2025 | $3,880 | $260,900 | $94,900 | $166,000 |
| 2024 | $3,994 | $269,700 | $94,900 | $174,800 |
| 2023 | $3,577 | $230,200 | $85,300 | $144,900 |
| 2022 | $3,503 | $222,300 | $77,400 | $144,900 |
| 2021 | $3,115 | $184,300 | $70,800 | $113,500 |
| 2020 | $3,131 | $184,300 | $70,800 | $113,500 |
| 2019 | $3,126 | $184,300 | $70,800 | $113,500 |
| 2018 | $3,142 | $184,300 | $70,800 | $113,500 |
| 2017 | $3,142 | $184,300 | $70,800 | $113,500 |
| 2016 | $3,084 | $181,500 | $68,000 | $113,500 |
| 2015 | $2,963 | $174,400 | $66,700 | $107,700 |
| 2014 | $719 | $174,400 | $66,700 | $107,700 |
Source: Public Records
Map
Nearby Homes
- 37 Day St
- 20 Sprague St
- 31 Russell St
- 78 Lowell St
- 278 Elm St
- 62 Washburn St
- 334 Elm St
- Lot 10 Ahiska Rd
- 56 Exposition Terrace
- 86 York St
- 92 Grove St
- 49-53 Jefferson Ave
- 13 Ringgold St
- 21 High St
- 524 Westfield St
- 456 Cold Spring Ave Unit 2A
- 49 Colony Rd
- 42 Ringgold St
- 482 Chestnut St
- 2942-2946 Main St