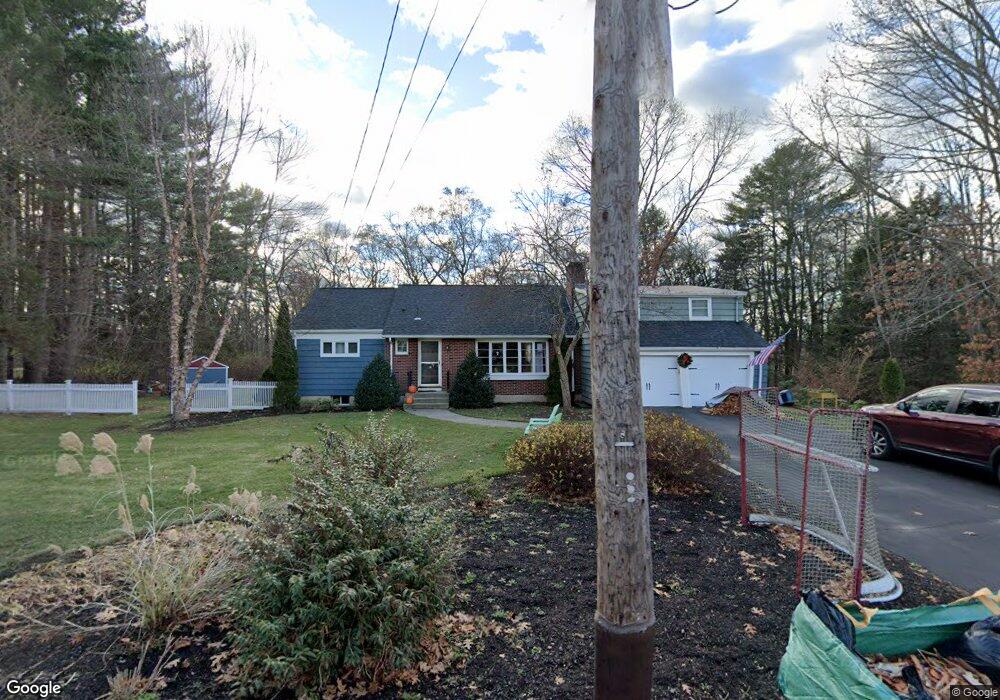
19 Jeffrey Rd Wayland, MA 01778
Estimated Value: $1,052,000 - $1,265,000
4
Beds
4
Baths
2,535
Sq Ft
$468/Sq Ft
Est. Value
About This Home
This home is located at 19 Jeffrey Rd, Wayland, MA 01778 and is currently estimated at $1,186,780, approximately $468 per square foot. 19 Jeffrey Rd is a home located in Middlesex County with nearby schools including Wayland High School.
Ownership History
Date
Name
Owned For
Owner Type
Purchase Details
Closed on
Nov 26, 2024
Sold by
Cavalluzzi Thomas and Ryall Kathleen
Bought by
Thomas N Cavalluzzi T N and Thomas Cavalluzzi
Current Estimated Value
Purchase Details
Closed on
May 13, 2005
Sold by
Clain Deborah R and Kreidberg Jordan A
Bought by
Ryall Kathleen and Cavalluzzi Thomas
Home Financials for this Owner
Home Financials are based on the most recent Mortgage that was taken out on this home.
Original Mortgage
$350,000
Interest Rate
6.05%
Mortgage Type
Purchase Money Mortgage
Purchase Details
Closed on
Oct 14, 1994
Sold by
Collins Ann L T and Collins Ann L
Bought by
Kreidberg Jordan A and Clain Deborah R
Create a Home Valuation Report for This Property
The Home Valuation Report is an in-depth analysis detailing your home's value as well as a comparison with similar homes in the area
Home Values in the Area
Average Home Value in this Area
Purchase History
| Date | Buyer | Sale Price | Title Company |
|---|---|---|---|
| Thomas N Cavalluzzi T N | -- | None Available | |
| Thomas N Cavalluzzi T N | -- | None Available | |
| Ryall Kathleen | $680,000 | -- | |
| Kreidberg Jordan A | $320,900 | -- | |
| Ryall Kathleen | $680,000 | -- | |
| Kreidberg Jordan A | $320,900 | -- |
Source: Public Records
Mortgage History
| Date | Status | Borrower | Loan Amount |
|---|---|---|---|
| Previous Owner | Kreidberg Jordan A | $310,000 | |
| Previous Owner | Kreidberg Jordan A | $315,000 | |
| Previous Owner | Ryall Kathleen | $350,000 |
Source: Public Records
Tax History Compared to Growth
Tax History
| Year | Tax Paid | Tax Assessment Tax Assessment Total Assessment is a certain percentage of the fair market value that is determined by local assessors to be the total taxable value of land and additions on the property. | Land | Improvement |
|---|---|---|---|---|
| 2025 | $15,682 | $1,003,300 | $617,900 | $385,400 |
| 2024 | $14,834 | $955,800 | $588,600 | $367,200 |
| 2023 | $14,406 | $865,200 | $535,000 | $330,200 |
| 2022 | $13,041 | $710,700 | $442,900 | $267,800 |
| 2021 | $8,289 | $668,500 | $402,700 | $265,800 |
| 2020 | $4,422 | $668,500 | $402,700 | $265,800 |
| 2019 | $11,728 | $641,600 | $383,600 | $258,000 |
| 2018 | $0 | $603,900 | $383,600 | $220,300 |
| 2017 | $10,746 | $592,400 | $372,100 | $220,300 |
| 2016 | $10,416 | $600,700 | $364,800 | $235,900 |
| 2015 | $11,047 | $600,700 | $364,800 | $235,900 |
Source: Public Records
Map
Nearby Homes
- 17 Hastings Way Unit 17
- 6 Old County Rd Unit 16
- 17 Glezen Ln
- 7 Shaw Dr
- 156 Boston Post Rd
- 271 Landham Rd
- 208 Cochituate Rd
- 11 Wadsworth Ln Unit 11
- 216 Landham Rd
- 24 Claypit Hill Rd
- 94 Goodmans Hill Rd
- 353 Old Connecticut Path
- 63 Landham Rd
- 22 Lakeshore Dr
- 0 Wagonwheel Rd
- 10 Hayward Rd
- 14 Lundy Ln
- 96 Lakeshore Dr
- 96 Lake Shore Dr
- 260 Cochituate Rd