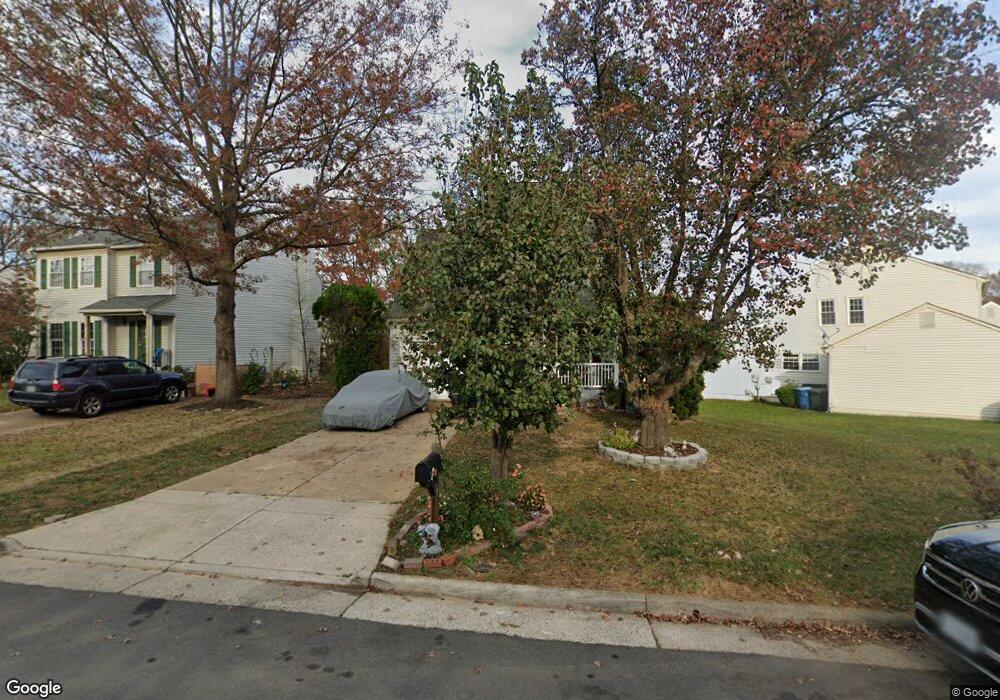
19 Jeremy Ct Sterling, VA 20165
Estimated Value: $656,000 - $692,000
3
Beds
3
Baths
1,360
Sq Ft
$496/Sq Ft
Est. Value
About This Home
This home is located at 19 Jeremy Ct, Sterling, VA 20165 and is currently estimated at $674,037, approximately $495 per square foot. 19 Jeremy Ct is a home located in Loudoun County with nearby schools including Countryside Elementary School, River Bend Middle School, and Potomac Falls High School.
Ownership History
Date
Name
Owned For
Owner Type
Purchase Details
Closed on
Mar 25, 2005
Sold by
Khouri Jean
Bought by
Funes Neri Flores and Maradiaga,Juan C
Current Estimated Value
Home Financials for this Owner
Home Financials are based on the most recent Mortgage that was taken out on this home.
Original Mortgage
$383,900
Outstanding Balance
$193,982
Interest Rate
5.56%
Mortgage Type
New Conventional
Estimated Equity
$480,055
Purchase Details
Closed on
Jul 26, 2002
Sold by
Thomas Gerard J
Bought by
Khouri Jean
Home Financials for this Owner
Home Financials are based on the most recent Mortgage that was taken out on this home.
Original Mortgage
$255,140
Interest Rate
6.73%
Purchase Details
Closed on
Jun 23, 1995
Sold by
Housman Clifford S
Bought by
Thomas Gerard J
Home Financials for this Owner
Home Financials are based on the most recent Mortgage that was taken out on this home.
Original Mortgage
$157,600
Interest Rate
7.82%
Create a Home Valuation Report for This Property
The Home Valuation Report is an in-depth analysis detailing your home's value as well as a comparison with similar homes in the area
Home Values in the Area
Average Home Value in this Area
Purchase History
| Date | Buyer | Sale Price | Title Company |
|---|---|---|---|
| Funes Neri Flores | $479,900 | -- | |
| Khouri Jean | $263,000 | -- | |
| Thomas Gerard J | $162,500 | -- |
Source: Public Records
Mortgage History
| Date | Status | Borrower | Loan Amount |
|---|---|---|---|
| Open | Funes Neri Flores | $383,900 | |
| Previous Owner | Khouri Jean | $255,140 | |
| Previous Owner | Thomas Gerard J | $157,600 |
Source: Public Records
Tax History Compared to Growth
Tax History
| Year | Tax Paid | Tax Assessment Tax Assessment Total Assessment is a certain percentage of the fair market value that is determined by local assessors to be the total taxable value of land and additions on the property. | Land | Improvement |
|---|---|---|---|---|
| 2025 | $4,892 | $607,730 | $237,000 | $370,730 |
| 2024 | $5,074 | $586,640 | $217,000 | $369,640 |
| 2023 | $4,943 | $564,860 | $217,000 | $347,860 |
| 2022 | $4,759 | $534,750 | $207,000 | $327,750 |
| 2021 | $4,370 | $445,890 | $183,500 | $262,390 |
| 2020 | $4,330 | $418,390 | $178,500 | $239,890 |
| 2019 | $4,187 | $400,640 | $178,500 | $222,140 |
| 2018 | $4,182 | $385,440 | $178,500 | $206,940 |
| 2017 | $4,390 | $390,260 | $178,500 | $211,760 |
| 2016 | $4,252 | $371,390 | $0 | $0 |
| 2015 | $4,141 | $186,380 | $0 | $186,380 |
| 2014 | $4,236 | $208,220 | $0 | $208,220 |
Source: Public Records
Map
Nearby Homes