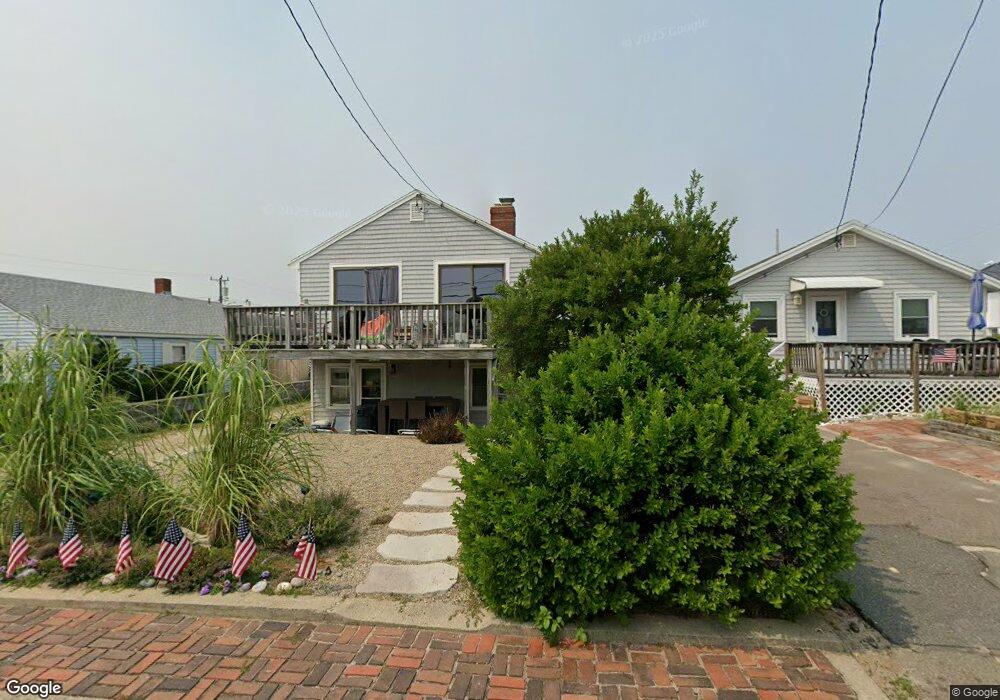
19 Julian St Humarock, MA 02047
Humarock NeighborhoodEstimated Value: $669,000 - $933,000
3
Beds
3
Baths
1,344
Sq Ft
$582/Sq Ft
Est. Value
About This Home
This home is located at 19 Julian St, Humarock, MA 02047 and is currently estimated at $782,366, approximately $582 per square foot. 19 Julian St is a home.
Ownership History
Date
Name
Owned For
Owner Type
Purchase Details
Closed on
Nov 22, 2022
Sold by
Toran Richard E and Toran Sarah A
Bought by
Mchugh Joanne T
Current Estimated Value
Purchase Details
Closed on
Oct 29, 2015
Sold by
Toran Sarah A and Toran Sally
Bought by
Toran Ft
Purchase Details
Closed on
Sep 20, 2011
Sold by
Quinn Catherine and Quinn David H
Bought by
Toran Sally
Purchase Details
Closed on
Oct 29, 2003
Sold by
Toran Rt and Toran Richard
Bought by
Quinn Catherine and Quinn David
Create a Home Valuation Report for This Property
The Home Valuation Report is an in-depth analysis detailing your home's value as well as a comparison with similar homes in the area
Home Values in the Area
Average Home Value in this Area
Purchase History
| Date | Buyer | Sale Price | Title Company |
|---|---|---|---|
| Mchugh Joanne T | -- | None Available | |
| Toran Richard E | -- | None Available | |
| Toran Ft | -- | -- | |
| Toran Sally | -- | -- | |
| Quinn Catherine | $175,000 | -- |
Source: Public Records
Mortgage History
| Date | Status | Borrower | Loan Amount |
|---|---|---|---|
| Closed | Quinn Catherine | $0 |
Source: Public Records
Tax History Compared to Growth
Tax History
| Year | Tax Paid | Tax Assessment Tax Assessment Total Assessment is a certain percentage of the fair market value that is determined by local assessors to be the total taxable value of land and additions on the property. | Land | Improvement |
|---|---|---|---|---|
| 2025 | $6,791 | $679,800 | $512,100 | $167,700 |
| 2024 | $6,209 | $599,300 | $431,100 | $168,200 |
| 2023 | $5,753 | $541,700 | $391,900 | $149,800 |
| 2022 | $5,753 | $455,900 | $315,900 | $140,000 |
| 2021 | $5,605 | $420,500 | $300,900 | $119,600 |
| 2020 | $5,524 | $409,200 | $300,900 | $108,300 |
| 2019 | $5,459 | $397,300 | $295,000 | $102,300 |
| 2018 | $4,567 | $327,400 | $244,100 | $83,300 |
| 2017 | $4,476 | $317,700 | $234,400 | $83,300 |
| 2016 | $4,354 | $307,900 | $224,600 | $83,300 |
| 2015 | $3,905 | $298,100 | $214,800 | $83,300 |
Source: Public Records
Map
Nearby Homes
- 21 Julian St
- 17 Julian St
- 20 Kenilworth St
- 18 Kenilworth St
- 16 Kenilworth St
- 16 Kenilworth St
- 95 River St
- 65 Ocean Front St
- 25 Julian St
- 56 Humarock Beach
- 95 N Revere St
- 26 Kenilworth St
- 15 Julian St
- 15 Julian St
- 12 Kenilworth St
- 15 Kenilworth St Unit 15
- 17 Kenilworth St
- 19 Kenilworth St
- 21 Kenilworth St
- 28 Julian St