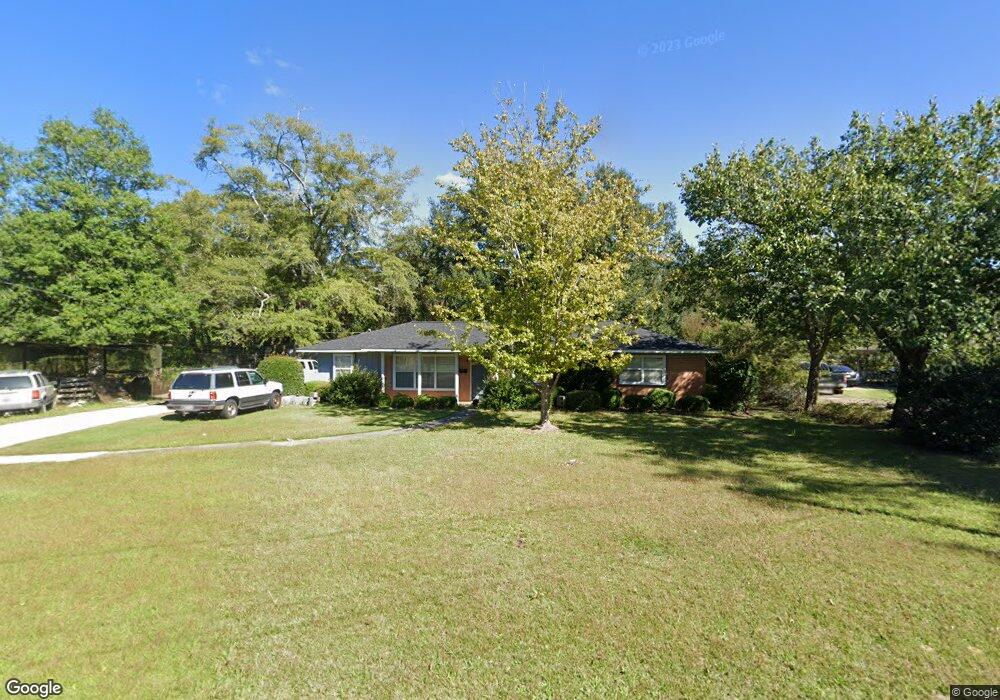
19 Kersey St Hazlehurst, GA 31539
Estimated Value: $73,412 - $108,000
3
Beds
1
Bath
1,096
Sq Ft
$78/Sq Ft
Est. Value
About This Home
This home is located at 19 Kersey St, Hazlehurst, GA 31539 and is currently estimated at $85,853, approximately $78 per square foot. 19 Kersey St is a home located in Jeff Davis County with nearby schools including Jeff Davis Primary School, Jeff Davis Elementary School, and Jeff Davis Middle School.
Ownership History
Date
Name
Owned For
Owner Type
Purchase Details
Closed on
Aug 17, 2018
Sold by
Deen James David
Bought by
Hall Angela M
Current Estimated Value
Home Financials for this Owner
Home Financials are based on the most recent Mortgage that was taken out on this home.
Original Mortgage
$32,500
Outstanding Balance
$19,028
Interest Rate
4.5%
Mortgage Type
New Conventional
Estimated Equity
$66,825
Purchase Details
Closed on
Sep 29, 2005
Sold by
Callahan Mark
Bought by
Deen James David and Deen Pamela Jan
Home Financials for this Owner
Home Financials are based on the most recent Mortgage that was taken out on this home.
Original Mortgage
$37,177
Interest Rate
5.66%
Mortgage Type
New Conventional
Purchase Details
Closed on
Feb 24, 1999
Bought by
Callahan Mark
Purchase Details
Closed on
Jan 1, 1946
Bought by
Mclendon O H
Create a Home Valuation Report for This Property
The Home Valuation Report is an in-depth analysis detailing your home's value as well as a comparison with similar homes in the area
Home Values in the Area
Average Home Value in this Area
Purchase History
| Date | Buyer | Sale Price | Title Company |
|---|---|---|---|
| Hall Angela M | $32,500 | -- | |
| Deen James David | $37,000 | -- | |
| Callahan Mark | $25,000 | -- | |
| Mclendon O H | -- | -- |
Source: Public Records
Mortgage History
| Date | Status | Borrower | Loan Amount |
|---|---|---|---|
| Open | Hall Angela M | $32,500 | |
| Previous Owner | Deen James David | $37,177 |
Source: Public Records
Tax History Compared to Growth
Tax History
| Year | Tax Paid | Tax Assessment Tax Assessment Total Assessment is a certain percentage of the fair market value that is determined by local assessors to be the total taxable value of land and additions on the property. | Land | Improvement |
|---|---|---|---|---|
| 2024 | $834 | $22,320 | $1,640 | $20,680 |
| 2023 | $629 | $16,835 | $1,673 | $15,162 |
| 2022 | $629 | $16,835 | $1,673 | $15,162 |
| 2021 | $629 | $16,835 | $1,673 | $15,162 |
| 2020 | $629 | $16,835 | $1,673 | $15,162 |
| 2019 | $486 | $16,835 | $1,673 | $15,162 |
| 2018 | $629 | $16,835 | $1,673 | $15,162 |
| 2017 | $479 | $16,590 | $1,673 | $14,917 |
| 2016 | $338 | $11,911 | $1,673 | $10,238 |
| 2015 | -- | $11,911 | $1,673 | $10,238 |
| 2014 | -- | $12,029 | $1,673 | $10,356 |
Source: Public Records
Map
Nearby Homes
- 73 Latimer St
- 44 Kersey St
- 116 Walton Way
- 0 Charles Rogers Blvd
- 4 Lakeside Dr
- 20 W Sycamore St
- 10 W 1st Ave
- 19 Martin Luther King jr Blvd
- 39 N Tallahassee St
- 45 Elton St
- 17 Young St
- 00 N Tallahassee St
- 104 N Tallahassee St
- 182 Rogers St
- 6 Lynnwood Dr
- 95 E Plum St
- 142 N Tallahassee St
- 29 Bellview Cir
- 185 S Cromartie St
- 0 Collins St