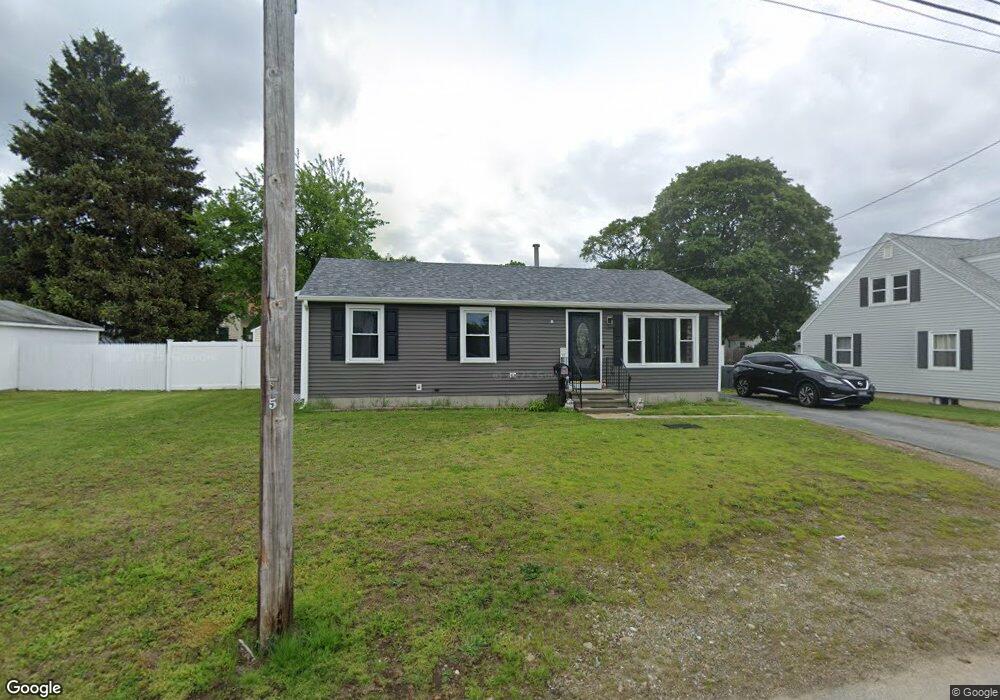
19 King St Johnston, RI 02919
Killingly Street NeighborhoodEstimated Value: $371,000 - $500,000
4
Beds
2
Baths
1,940
Sq Ft
$229/Sq Ft
Est. Value
About This Home
This home is located at 19 King St, Johnston, RI 02919 and is currently estimated at $445,003, approximately $229 per square foot. 19 King St is a home located in Providence County with nearby schools including Johnston Senior High School and Mount Pleasant Academy.
Ownership History
Date
Name
Owned For
Owner Type
Purchase Details
Closed on
Jan 4, 2010
Sold by
Russo Joseph M
Bought by
Stevenson Diana J
Current Estimated Value
Home Financials for this Owner
Home Financials are based on the most recent Mortgage that was taken out on this home.
Original Mortgage
$180,667
Outstanding Balance
$118,015
Interest Rate
4.85%
Mortgage Type
Purchase Money Mortgage
Estimated Equity
$326,988
Purchase Details
Closed on
Jul 1, 1999
Sold by
United Guaranty Res Co
Bought by
Russo Joseph M
Purchase Details
Closed on
May 24, 1994
Sold by
A Ialongo Bldg Co Inc
Bought by
Carrier Michael P and Carrier Cheryl
Create a Home Valuation Report for This Property
The Home Valuation Report is an in-depth analysis detailing your home's value as well as a comparison with similar homes in the area
Home Values in the Area
Average Home Value in this Area
Purchase History
| Date | Buyer | Sale Price | Title Company |
|---|---|---|---|
| Stevenson Diana J | $184,000 | -- | |
| Russo Joseph M | $91,500 | -- | |
| Carrier Michael P | $96,000 | -- | |
| Stevenson Diana J | $184,000 | -- | |
| Russo Joseph M | $91,500 | -- | |
| Carrier Michael P | $96,000 | -- |
Source: Public Records
Mortgage History
| Date | Status | Borrower | Loan Amount |
|---|---|---|---|
| Open | Carrier Michael P | $180,667 | |
| Closed | Carrier Michael P | $180,667 | |
| Previous Owner | Carrier Michael P | $75,000 |
Source: Public Records
Tax History
| Year | Tax Paid | Tax Assessment Tax Assessment Total Assessment is a certain percentage of the fair market value that is determined by local assessors to be the total taxable value of land and additions on the property. | Land | Improvement |
|---|---|---|---|---|
| 2025 | $5,236 | $335,200 | $87,000 | $248,200 |
| 2024 | $5,129 | $335,200 | $87,000 | $248,200 |
| 2023 | $5,129 | $335,200 | $87,000 | $248,200 |
| 2022 | $3,997 | $215,000 | $64,400 | $150,600 |
| 2021 | $4,997 | $215,000 | $64,400 | $150,600 |
| 2018 | $4,563 | $166,000 | $47,900 | $118,100 |
| 2016 | $6,037 | $166,000 | $47,900 | $118,100 |
| 2015 | $4,734 | $163,300 | $48,400 | $114,900 |
| 2014 | $3,756 | $163,300 | $48,400 | $114,900 |
| 2013 | $4,695 | $163,300 | $48,400 | $114,900 |
Source: Public Records
Map
Nearby Homes
Your Personal Tour Guide
Ask me questions while you tour the home.