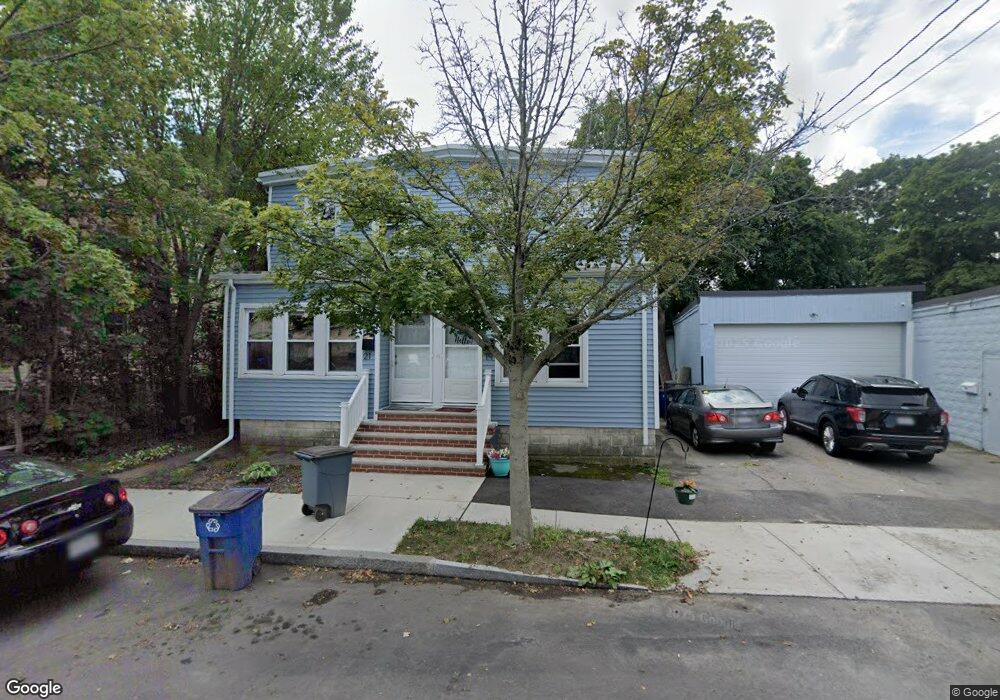
19 Lancaster St Quincy, MA 02169
Quincy Point NeighborhoodEstimated Value: $767,069 - $1,021,000
3
Beds
2
Baths
2,364
Sq Ft
$388/Sq Ft
Est. Value
About This Home
This home is located at 19 Lancaster St, Quincy, MA 02169 and is currently estimated at $918,267, approximately $388 per square foot. 19 Lancaster St is a home located in Norfolk County with nearby schools including Point Webster Middle School, Clifford H. Marshall Elementary School, and Quincy High School.
Ownership History
Date
Name
Owned For
Owner Type
Purchase Details
Closed on
Dec 5, 2016
Sold by
Tsang Chong W
Bought by
Cheong Gabriel
Current Estimated Value
Home Financials for this Owner
Home Financials are based on the most recent Mortgage that was taken out on this home.
Original Mortgage
$427,500
Outstanding Balance
$349,136
Interest Rate
3.52%
Mortgage Type
New Conventional
Estimated Equity
$569,131
Purchase Details
Closed on
Aug 18, 2008
Sold by
Tsang Chong W and Tsang Sai C
Bought by
Tsang Chong W
Create a Home Valuation Report for This Property
The Home Valuation Report is an in-depth analysis detailing your home's value as well as a comparison with similar homes in the area
Home Values in the Area
Average Home Value in this Area
Purchase History
| Date | Buyer | Sale Price | Title Company |
|---|---|---|---|
| Cheong Gabriel | $570,000 | -- | |
| Tsang Chong W | -- | -- |
Source: Public Records
Mortgage History
| Date | Status | Borrower | Loan Amount |
|---|---|---|---|
| Open | Cheong Gabriel | $427,500 |
Source: Public Records
Tax History
| Year | Tax Paid | Tax Assessment Tax Assessment Total Assessment is a certain percentage of the fair market value that is determined by local assessors to be the total taxable value of land and additions on the property. | Land | Improvement |
|---|---|---|---|---|
| 2025 | $9,631 | $835,300 | $255,700 | $579,600 |
| 2024 | $9,090 | $806,600 | $243,500 | $563,100 |
| 2023 | $8,731 | $784,500 | $221,400 | $563,100 |
| 2022 | $7,880 | $657,800 | $201,200 | $456,600 |
| 2021 | $7,427 | $611,800 | $201,200 | $410,600 |
| 2020 | $7,458 | $600,000 | $189,800 | $410,200 |
| 2019 | $6,517 | $519,300 | $175,800 | $343,500 |
| 2018 | $6,453 | $483,700 | $159,800 | $323,900 |
| 2017 | $6,415 | $452,700 | $152,200 | $300,500 |
| 2016 | $5,718 | $398,200 | $138,300 | $259,900 |
| 2015 | $5,490 | $376,000 | $130,500 | $245,500 |
| 2014 | $4,708 | $316,800 | $130,500 | $186,300 |
Source: Public Records
Map
Nearby Homes
- 5 Main St
- 22 James St
- 35 Miller Stile Rd
- 51 Sumner St
- 97 Sumner St Unit 1
- 66 Mcgrath Hwy Unit 302
- 66 Mcgrath Hwy Unit 402
- 66 Mcgrath Hwy Unit 309
- 66 Mcgrath Hwy Unit 201
- 33 Elm St
- 161 Sumner St Unit 2
- 59 Spear St Unit 201
- 59 Spear St Unit 302
- 59 Spear St Unit 402
- 59 Spear St Unit 202
- 59 Spear St Unit 301
- 388 Washington St Unit 301
- 388 Washington St Unit 205
- 388 Washington St Unit 405
- 388 Washington St Unit 202
- 21 Lancaster St
- 19 Lancaster St Unit 21
- 19 Lancaster St Unit 19
- 23 Lancaster St
- 23 Lancaster St Unit 2
- 15 Lancaster St
- 19 Fowler St
- 19 Fowler St Unit 19
- 13 Lancaster St
- 88 Edwards St Unit 88
- 27 Lancaster St
- 6 Lancesta Rd
- 80 Edwards St
- 24 Lancaster St
- 20 Fowler St
- 12 Lancaster St
- 12 Lancaster St
- 12 Lancaster St Unit 1
- 12 Lancaster St
- 12 Lancaster St Unit 2
Your Personal Tour Guide
Ask me questions while you tour the home.