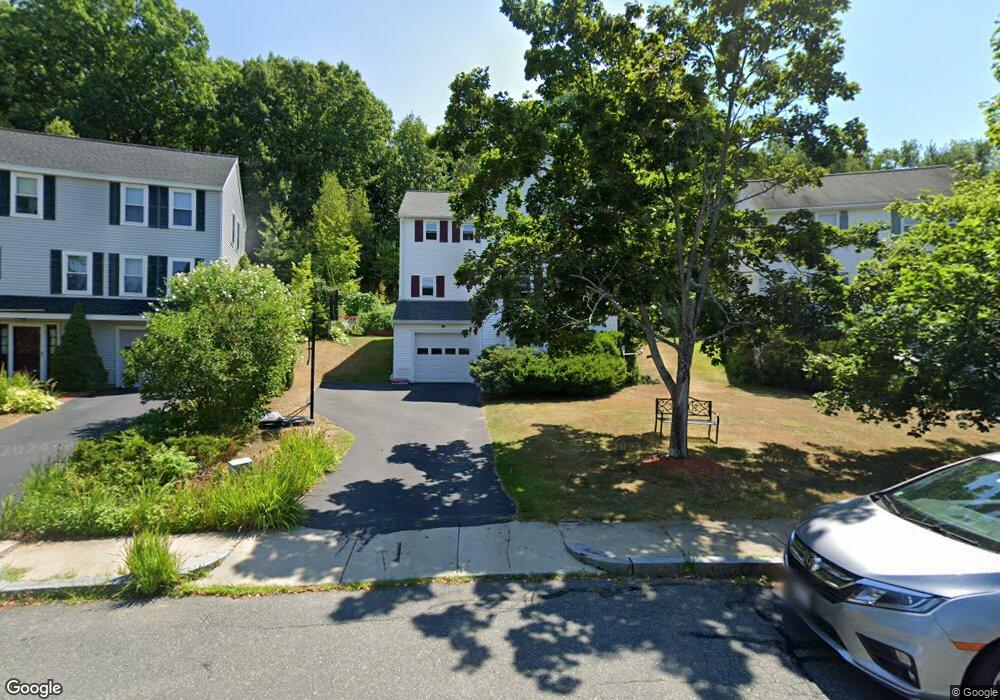
19 Lawtons Way Westborough, MA 01581
Estimated Value: $657,000 - $755,000
3
Beds
3
Baths
1,368
Sq Ft
$515/Sq Ft
Est. Value
About This Home
This home is located at 19 Lawtons Way, Westborough, MA 01581 and is currently estimated at $703,907, approximately $514 per square foot. 19 Lawtons Way is a home located in Worcester County with nearby schools including Westborough High School, Westboro Knowledge Beginnings, and Ebridge Montessori School.
Ownership History
Date
Name
Owned For
Owner Type
Purchase Details
Closed on
Nov 1, 2004
Sold by
Yu Lansha and Shi Pengyu
Bought by
Peng Min and Xia Fang
Current Estimated Value
Home Financials for this Owner
Home Financials are based on the most recent Mortgage that was taken out on this home.
Original Mortgage
$60,000
Interest Rate
5.74%
Mortgage Type
Purchase Money Mortgage
Purchase Details
Closed on
Jan 14, 2002
Sold by
Lee Lin Fu and Lee Chin Lan C
Bought by
Shi Pengyu and Yu Lansha
Purchase Details
Closed on
Oct 11, 1996
Sold by
Steckler David K and Steckler Donna
Bought by
Lee Chin L and Lee Lin F
Purchase Details
Closed on
Apr 3, 1995
Sold by
Esposito Michael and Esposito Sandra
Bought by
Steckler David and Steckler Donna
Purchase Details
Closed on
Mar 12, 1993
Sold by
North Hill Homes Rt and Mcbride John C
Bought by
Esposito Michael J and Johnson Sandra A
Create a Home Valuation Report for This Property
The Home Valuation Report is an in-depth analysis detailing your home's value as well as a comparison with similar homes in the area
Home Values in the Area
Average Home Value in this Area
Purchase History
| Date | Buyer | Sale Price | Title Company |
|---|---|---|---|
| Peng Min | $343,998 | -- | |
| Shi Pengyu | $266,000 | -- | |
| Lee Chin L | $155,000 | -- | |
| Steckler David | $149,000 | -- | |
| Esposito Michael J | $142,661 | -- |
Source: Public Records
Mortgage History
| Date | Status | Borrower | Loan Amount |
|---|---|---|---|
| Open | Esposito Michael J | $260,000 | |
| Closed | Esposito Michael J | $265,000 | |
| Closed | Peng Min | $60,000 | |
| Closed | Peng Min | $266,700 |
Source: Public Records
Tax History Compared to Growth
Tax History
| Year | Tax Paid | Tax Assessment Tax Assessment Total Assessment is a certain percentage of the fair market value that is determined by local assessors to be the total taxable value of land and additions on the property. | Land | Improvement |
|---|---|---|---|---|
| 2025 | $9,909 | $608,300 | $319,200 | $289,100 |
| 2024 | $9,132 | $556,500 | $283,900 | $272,600 |
| 2023 | $8,799 | $522,500 | $267,700 | $254,800 |
| 2022 | $8,075 | $436,700 | $226,400 | $210,300 |
| 2021 | $5,897 | $426,800 | $216,500 | $210,300 |
| 2020 | $7,396 | $403,700 | $198,800 | $204,900 |
| 2019 | $7,017 | $382,800 | $200,700 | $182,100 |
| 2018 | $0 | $355,000 | $192,900 | $162,100 |
| 2017 | $6,319 | $355,000 | $192,900 | $162,100 |
| 2016 | $5,944 | $334,500 | $177,100 | $157,400 |
| 2015 | $5,620 | $302,300 | $157,400 | $144,900 |
Source: Public Records
Map
Nearby Homes
- 8 Stagecoach Cir Unit 8
- 196 -198 Turnpike Rd
- 155 Milk St Unit 5
- 59 Indian Meadow Dr
- 9 Shaker Way
- 3 Dover Way
- 22 Treetop Park
- 9 Treetop Park
- 19 Treetop Park Unit 19
- 349 Brigham St
- 1 Hamilton Rd
- 5 Chauncy Cir
- 223 South St
- 14 Mayberry Dr Unit 10
- 7 Mayberry Dr Unit H
- 198 South St
- 19 Fisher St
- 11 Hillside Rd
- 48 High Street Extension
- 185-187 South St
- 17 Lawtons Way
- 21 Lawtons Way
- 15 Lawtons Way
- 23 Lawtons Way
- 24 Lawtons Way
- 11 Lawtons Way
- 22 Lawtons Way
- 9 Lawtons Way
- 20 Lawtons Way
- 7 Lawtons Way
- 5 Lawtons Way
- 18 Lawtons Way
- 16 Lawtons Way
- 3 Lawtons Way
- 14 Lawtons Way
- 6 Lawtons Way
- 8 Lawtons Way
- 12 Lawtons Way
- 12 Lawtons Way Unit 12
- 10 Lawtons Way