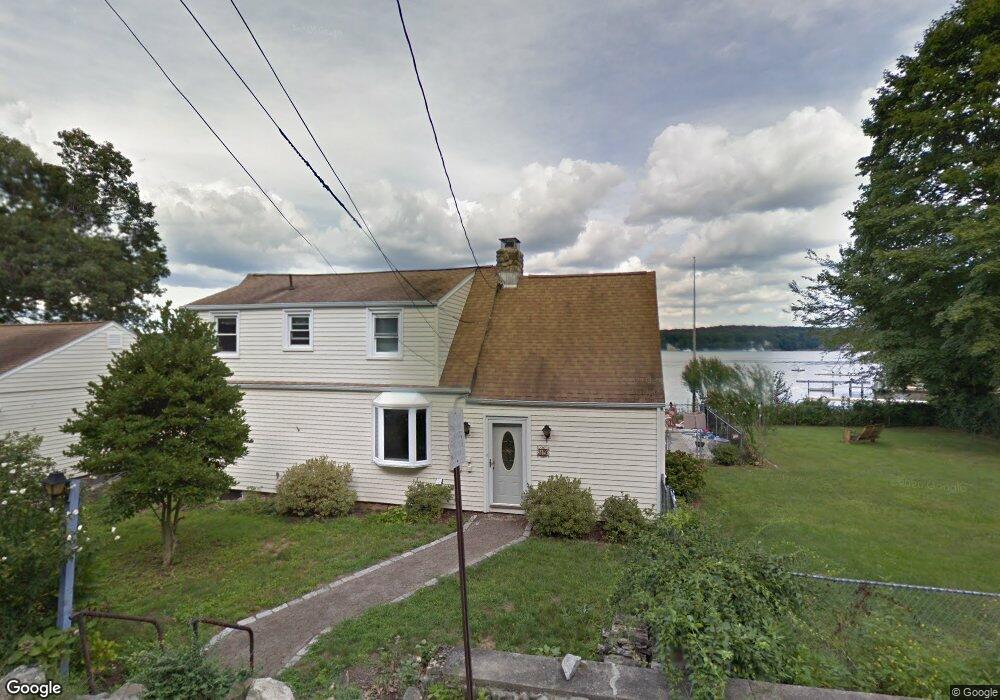
19 Ledge Rd Niantic, CT 06357
Estimated Value: $1,157,000 - $1,197,000
3
Beds
3
Baths
2,142
Sq Ft
$548/Sq Ft
Est. Value
About This Home
This home is located at 19 Ledge Rd, Niantic, CT 06357 and is currently estimated at $1,173,504, approximately $547 per square foot. 19 Ledge Rd is a home located in New London County with nearby schools including East Lyme Middle School, East Lyme High School, and Carelot Children's Center - East Lyme.
Ownership History
Date
Name
Owned For
Owner Type
Purchase Details
Closed on
Nov 21, 2014
Sold by
Buzzelli Barbara A
Bought by
Buzzelli Barbara A and Buzzelli Randy J
Current Estimated Value
Home Financials for this Owner
Home Financials are based on the most recent Mortgage that was taken out on this home.
Original Mortgage
$253,500
Outstanding Balance
$192,874
Interest Rate
4.13%
Mortgage Type
New Conventional
Estimated Equity
$980,630
Purchase Details
Closed on
Oct 17, 1994
Sold by
Georg Peter and Georg Judith
Bought by
Painter Edward D and Painter Doris E
Create a Home Valuation Report for This Property
The Home Valuation Report is an in-depth analysis detailing your home's value as well as a comparison with similar homes in the area
Home Values in the Area
Average Home Value in this Area
Purchase History
| Date | Buyer | Sale Price | Title Company |
|---|---|---|---|
| Buzzelli Barbara A | -- | -- | |
| Painter David R | -- | -- | |
| Painter David R | $125,000 | -- | |
| Painter Edward D | $315,000 | -- | |
| Buzzelli Barbara A | -- | -- | |
| Painter Edward D | $315,000 | -- |
Source: Public Records
Mortgage History
| Date | Status | Borrower | Loan Amount |
|---|---|---|---|
| Open | Painter Edward D | $253,500 | |
| Closed | Painter Edward D | $253,500 |
Source: Public Records
Tax History
| Year | Tax Paid | Tax Assessment Tax Assessment Total Assessment is a certain percentage of the fair market value that is determined by local assessors to be the total taxable value of land and additions on the property. | Land | Improvement |
|---|---|---|---|---|
| 2025 | $17,987 | $642,180 | $441,210 | $200,970 |
| 2024 | $16,921 | $642,180 | $441,210 | $200,970 |
| 2023 | $15,977 | $642,180 | $441,210 | $200,970 |
| 2022 | $15,310 | $642,180 | $441,210 | $200,970 |
| 2021 | $13,397 | $469,910 | $336,910 | $133,000 |
| 2020 | $13,327 | $469,910 | $336,910 | $133,000 |
| 2019 | $13,247 | $469,910 | $336,910 | $133,000 |
| 2018 | $12,852 | $469,910 | $336,910 | $133,000 |
| 2017 | $12,293 | $469,910 | $336,910 | $133,000 |
| 2016 | $13,951 | $550,130 | $417,130 | $133,000 |
| 2015 | $13,592 | $550,060 | $417,130 | $132,930 |
| 2014 | $13,218 | $550,060 | $417,130 | $132,930 |
Source: Public Records
Map
Nearby Homes
- 20 North Rd
- 47 Oswegatchie Hills Rd
- 10 S Ledge Rock Rd
- 6 Fulmore Dr
- 163 Oswegatchie Rd
- 276 Niantic River Rd
- 3 E Wood St
- 185 Main St Unit 301
- 185 Main St Unit 305
- 9 Arrowhead Trail
- 7 Point Comfort
- 398 Boston Post Rd
- 398 & 402 Boston Post Rd
- 37 Stoneywood Dr
- 269 Flanders Rd Unit 1B
- 468 Main St Unit 318
- 468 Main St Unit 111
- 46 Village Crossing Unit 46
- 47 Village Crossing Unit 47
- 49 Cross Rd
Your Personal Tour Guide
Ask me questions while you tour the home.