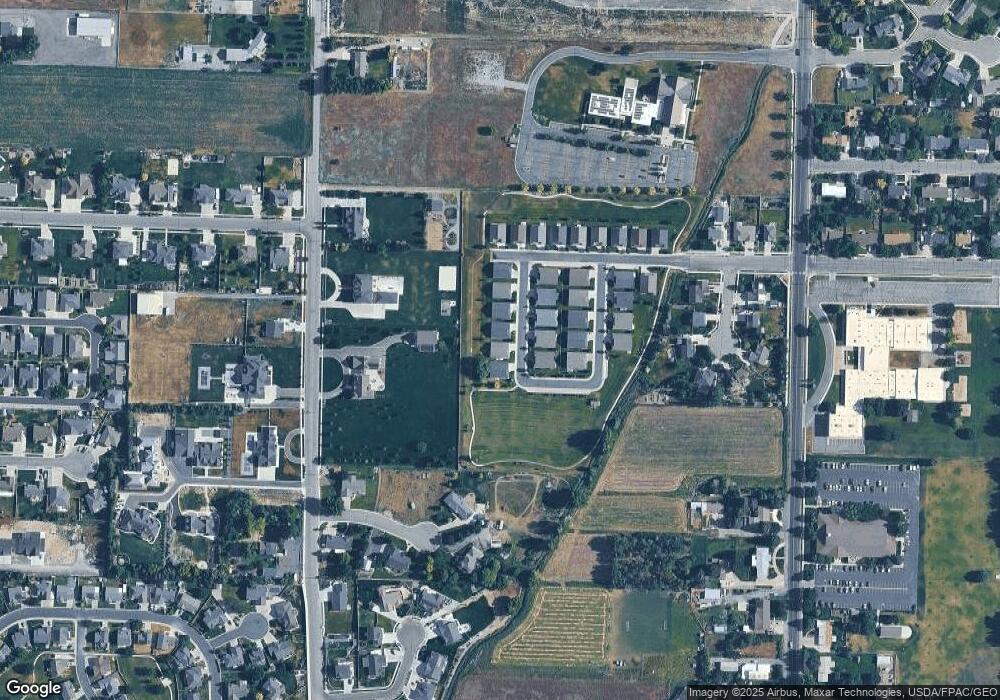
19 Leisure Loop Hyde Park, UT 84318
Estimated Value: $466,000 - $490,623
2
Beds
2
Baths
1,637
Sq Ft
$293/Sq Ft
Est. Value
About This Home
This home is located at 19 Leisure Loop, Hyde Park, UT 84318 and is currently estimated at $478,906, approximately $292 per square foot. 19 Leisure Loop is a home located in Cache County with nearby schools including North Park School, Cedar Ridge School, and North Cache Middle School.
Ownership History
Date
Name
Owned For
Owner Type
Purchase Details
Closed on
Oct 18, 2023
Sold by
Liechty Mada H
Bought by
Blackett Paula Ann
Current Estimated Value
Purchase Details
Closed on
Nov 3, 2021
Sold by
Andrew Glenda D and The Andrew Family Trust
Bought by
Liechty Mada H
Purchase Details
Closed on
Aug 15, 2017
Sold by
Andrew Glenda D
Bought by
Andrew Glenda D and Andrew Family Trust
Home Financials for this Owner
Home Financials are based on the most recent Mortgage that was taken out on this home.
Original Mortgage
$159,000
Interest Rate
3.96%
Mortgage Type
New Conventional
Create a Home Valuation Report for This Property
The Home Valuation Report is an in-depth analysis detailing your home's value as well as a comparison with similar homes in the area
Home Values in the Area
Average Home Value in this Area
Purchase History
| Date | Buyer | Sale Price | Title Company |
|---|---|---|---|
| Blackett Paula Ann | -- | Pinnacle Title | |
| Liechty Mada H | -- | Cache Title Logan | |
| Andrew Glenda D | -- | None Available | |
| Andrew Glenda D | -- | None Available |
Source: Public Records
Mortgage History
| Date | Status | Borrower | Loan Amount |
|---|---|---|---|
| Previous Owner | Andrew Glenda D | $159,000 |
Source: Public Records
Tax History
| Year | Tax Paid | Tax Assessment Tax Assessment Total Assessment is a certain percentage of the fair market value that is determined by local assessors to be the total taxable value of land and additions on the property. | Land | Improvement |
|---|---|---|---|---|
| 2025 | $1,833 | $252,675 | $0 | $0 |
| 2023 | $1,924 | $232,705 | $0 | $0 |
| 2022 | $2,001 | $232,705 | $0 | $0 |
| 2021 | $2,032 | $371,134 | $70,000 | $301,134 |
| 2020 | $1,911 | $331,856 | $70,000 | $261,856 |
| 2019 | $2,013 | $331,856 | $70,000 | $261,856 |
| 2018 | $1,787 | $288,800 | $55,000 | $233,800 |
| 2017 | $646 | $55,000 | $0 | $0 |
| 2016 | $656 | $55,000 | $0 | $0 |
| 2015 | $649 | $55,000 | $0 | $0 |
| 2014 | $420 | $36,500 | $0 | $0 |
Source: Public Records
Map
Nearby Homes
- 27 Leisure Loop
- 200 E Memory Ln Unit LNP2
- 200 E Memory Ln
- 29 Leisure Loop
- 200 E Memory Ln Unit 6
- 10 Leisure Loop
- 4 E Memory Ln
- 3 E Memory Ln
- 28 Leisure Loop
- 12 Leisure Loop
- 26 Leisure Loop
- 25 Leisure Loop
- 24 Leisure Loop
- 14 Leisure Loop
- 11 Leisure Loop
- 13 Leisure Loop
- 23 Leisure Loop
- 16 Leisure Loop
- 22 Leisure Loop
- 15 Leisure Loop
Your Personal Tour Guide
Ask me questions while you tour the home.