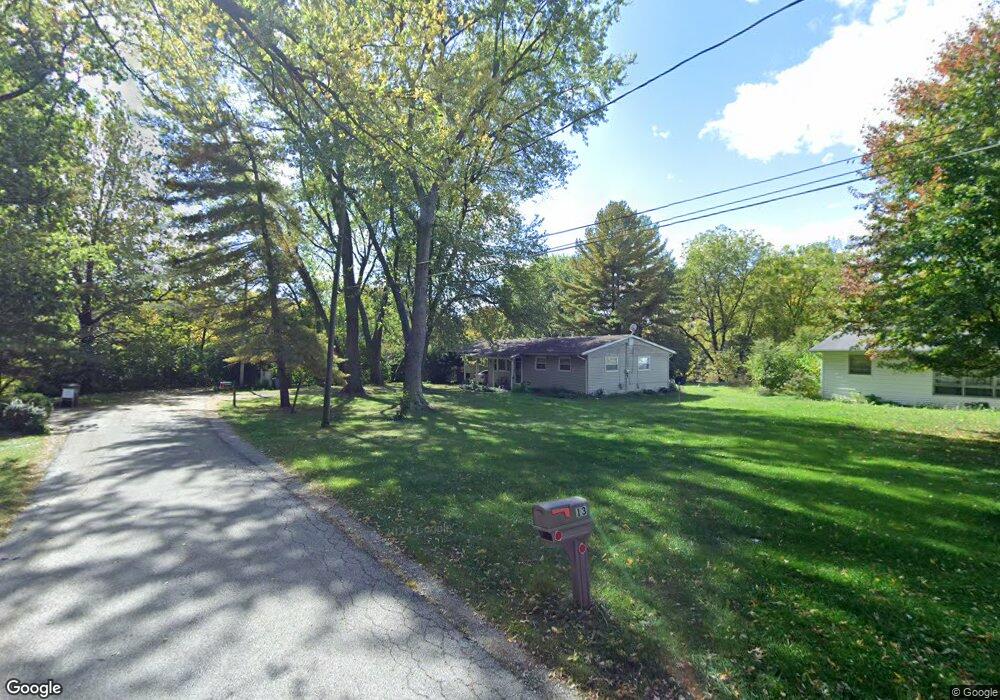
19 Lenel Dr Belleville, IL 62223
Estimated Value: $144,626 - $248,000
Studio
--
Bath
816
Sq Ft
$220/Sq Ft
Est. Value
About This Home
This home is located at 19 Lenel Dr, Belleville, IL 62223 and is currently estimated at $179,657, approximately $220 per square foot. 19 Lenel Dr is a home located in St. Clair County with nearby schools including Signal Hill Elementary School, Blessed Sacrament Catholic School, and Sister Thea Bowman Catholic School.
Ownership History
Date
Name
Owned For
Owner Type
Purchase Details
Closed on
Sep 27, 2001
Sold by
Federal National Mortgage Association
Bought by
Wheetley Dore E
Current Estimated Value
Home Financials for this Owner
Home Financials are based on the most recent Mortgage that was taken out on this home.
Original Mortgage
$66,457
Outstanding Balance
$26,166
Interest Rate
6.97%
Mortgage Type
FHA
Estimated Equity
$153,491
Purchase Details
Closed on
Aug 2, 2001
Sold by
Mcgee Lisa M
Bought by
Federal National Mortgage Association
Home Financials for this Owner
Home Financials are based on the most recent Mortgage that was taken out on this home.
Original Mortgage
$66,457
Outstanding Balance
$26,166
Interest Rate
6.97%
Mortgage Type
FHA
Estimated Equity
$153,491
Purchase Details
Closed on
Sep 1, 1997
Bought by
Wheetley Dore E
Create a Home Valuation Report for This Property
The Home Valuation Report is an in-depth analysis detailing your home's value as well as a comparison with similar homes in the area
Home Values in the Area
Average Home Value in this Area
Purchase History
| Date | Buyer | Sale Price | Title Company |
|---|---|---|---|
| Wheetley Dore E | -- | Metro East Title Corp | |
| Federal National Mortgage Association | $73,289 | -- | |
| Wheetley Dore E | $64,000 | -- |
Source: Public Records
Mortgage History
| Date | Status | Borrower | Loan Amount |
|---|---|---|---|
| Open | Wheetley Dore E | $66,457 |
Source: Public Records
Tax History
| Year | Tax Paid | Tax Assessment Tax Assessment Total Assessment is a certain percentage of the fair market value that is determined by local assessors to be the total taxable value of land and additions on the property. | Land | Improvement |
|---|---|---|---|---|
| 2024 | $3,351 | $37,964 | $13,396 | $24,568 |
| 2023 | $3,075 | $34,064 | $12,020 | $22,044 |
| 2022 | $2,895 | $30,911 | $10,907 | $20,004 |
| 2021 | $2,762 | $28,698 | $10,126 | $18,572 |
| 2020 | $2,702 | $27,398 | $9,853 | $17,545 |
| 2019 | $2,666 | $27,398 | $9,853 | $17,545 |
| 2018 | $2,588 | $26,180 | $9,415 | $16,765 |
| 2017 | $2,437 | $24,381 | $8,768 | $15,613 |
| 2016 | $2,344 | $23,794 | $8,329 | $15,465 |
| 2014 | $2,252 | $23,931 | $8,377 | $15,554 |
| 2013 | $3,477 | $25,531 | $8,937 | $16,594 |
Source: Public Records
Map
Nearby Homes
Your Personal Tour Guide
Ask me questions while you tour the home.