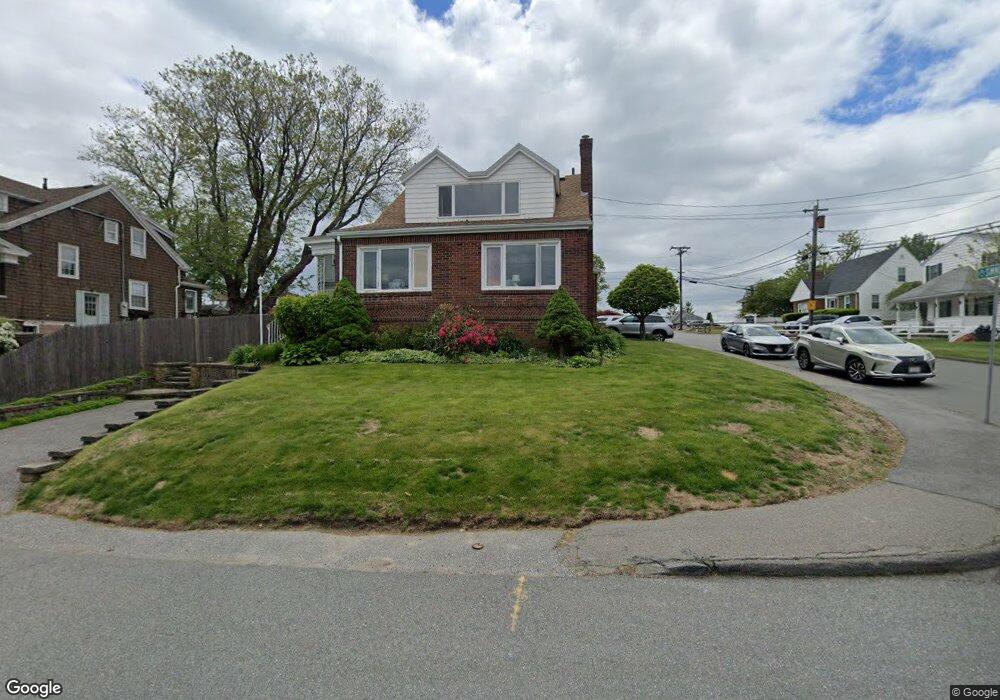
19 Lennox Rd Nahant, MA 01908
Estimated Value: $848,018 - $1,028,000
2
Beds
2
Baths
2,135
Sq Ft
$457/Sq Ft
Est. Value
About This Home
This home is located at 19 Lennox Rd, Nahant, MA 01908 and is currently estimated at $974,755, approximately $456 per square foot. 19 Lennox Rd is a home located in Essex County with nearby schools including Johnson Elementary School, Swampscott Middle School, and Swampscott High School.
Ownership History
Date
Name
Owned For
Owner Type
Purchase Details
Closed on
Nov 13, 1998
Sold by
Chan Jennie Mae
Bought by
Thornton Janice Susan
Current Estimated Value
Home Financials for this Owner
Home Financials are based on the most recent Mortgage that was taken out on this home.
Original Mortgage
$176,000
Outstanding Balance
$38,619
Interest Rate
6.65%
Mortgage Type
Purchase Money Mortgage
Estimated Equity
$936,136
Create a Home Valuation Report for This Property
The Home Valuation Report is an in-depth analysis detailing your home's value as well as a comparison with similar homes in the area
Home Values in the Area
Average Home Value in this Area
Purchase History
| Date | Buyer | Sale Price | Title Company |
|---|---|---|---|
| Thornton Janice Susan | $220,000 | -- |
Source: Public Records
Mortgage History
| Date | Status | Borrower | Loan Amount |
|---|---|---|---|
| Open | Thornton Janice Susan | $176,000 |
Source: Public Records
Tax History Compared to Growth
Tax History
| Year | Tax Paid | Tax Assessment Tax Assessment Total Assessment is a certain percentage of the fair market value that is determined by local assessors to be the total taxable value of land and additions on the property. | Land | Improvement |
|---|---|---|---|---|
| 2025 | $7,277 | $795,300 | $418,100 | $377,200 |
| 2024 | $7,052 | $777,500 | $400,300 | $377,200 |
| 2023 | $6,467 | $711,400 | $355,800 | $355,600 |
| 2022 | $6,094 | $622,500 | $302,400 | $320,100 |
| 2021 | $5,889 | $560,300 | $284,700 | $275,600 |
| 2020 | $5,950 | $542,400 | $266,900 | $275,500 |
| 2019 | $5,141 | $471,200 | $249,100 | $222,100 |
| 2018 | $4,830 | $471,200 | $249,100 | $222,100 |
| 2017 | $4,933 | $471,200 | $249,100 | $222,100 |
| 2016 | $4,523 | $429,900 | $217,900 | $212,000 |
| 2015 | $4,525 | $414,400 | $202,400 | $212,000 |
| 2014 | $4,369 | $396,100 | $184,100 | $212,000 |
Source: Public Records
Map
Nearby Homes
- 36 Lennox Rd
- 9 Little Nahant Rd
- 23 Phillips Rd
- 17 Pearl Rd
- 66 Ocean St
- 43 Maple Ave
- 2 Goddard Dr
- 303 Nahant Rd
- 183 Bass Point Rd
- 51 Cliff St
- 3 Cliff St
- 98 Lynnway Unit 102
- 9 Beach Rd Unit 4
- 12 Chancery Ct Unit 205
- 12 Chancery Ct Unit 207
- 45 Tudor St Unit 3-8
- 41 Tudor St
- 154 Lynnway Unit 520
- 154 Lynnway Unit 205
- 154 Lynnway Unit 213